- Introduction
- Packages and Ideas
- Country Information
- Journals from Sri Lanka
- Rank changes for Sri Lankan Journals
- SJR values changing for Sri Lankan Journals
- References per Document changing for Sri Lankan Journals
- Publishers and Journals from Sri Lanka
- Total Documents and References for Journals from Sri Lanka
- Three year time period for Journals from Sri Lanka
- Journals and categories
Introduction
“SCImago Journal and Country Rank provides valuable estimates of academic journals’ prestige.”, this is according to its GitHub repository which could be found here. I completely agree with this statement, last year(2018) while searching for journals to publish a research of my interest and contribution this website came in useful comparative to most of my Google searches.
It is crucial to find a journal which summarizes the research work we intend to contribute with more relative information such as ranking, h-index, citations and etc which could be compared for our benefit. Usually people tend to collect information by themselves and might miss a valuable and more suitable opportunity to publish because they did not know where to find them. That will not occur if you use SciMagoJr.
Packages and Ideas
As a Researcher from Sri Lanka I am much more interested in how we as a country has made progress in related to journals or research publishing in perspective of our neighboring countries and fields of research interest.
The package sjrdata has three data-sets and they provide information regarding to journals which is mostly seeked by researchers to find an appropriate place to publish their research or find places which would benefit them in finding a unique research problem.
# Data
library(sjrdata)

# Packages
library(tidyverse)
library(gganimate)
library(ggrepel)
library(magrittr)
library(lubridate)
library(splitstackshape)
library(qdap)
library(ggthemr)
ggthemr("flat dark")
The three data-sets in concern are
sjr_countries - Contains information regarding h_index over the years for countries and their ranks with other information related to documents.
sjr_journals - Records for type of document with their basic information which can be connected to country of origin, publisher and fields of interest and much more.
sjr_countries_1996_2017 - Similar to sjr_countries but this is an accumulation of the data-set which would indicate the overall performance as a country from 1996 to 2017.
Country Information
This section will simply scrutinize how Sri Lanka over the years has performed and it should be noted that only the ranks of South Asian Region countries will be compared for the purpose of understanding the progress as a whole community.
Ranking of Sri Lanka from 1996 to 2017
Sri Lanka(SL) had its ups and downs in the rankings where the worst place was to be in 85th and the best place to be in 75th. As of in 2017 it has reached 78th which is good considering the previous three years(2014-2016) the ranks were higher.
In 1996 SL was holding 85th and this occurs again in the years 2011 and 2014. Also it reached the 75th ranking position in year 2007. I sincerely hope that in the coming years SL would reach better ranks.
subset(sjr_countries,country=="Sri Lanka") %>%
  mutate(year=year(as.Date(year,"%Y"))) %>%
ggplot(.,aes(x=year,y=rank,label=rank))+
  geom_point()+geom_line()+
  geom_text_repel()+
  xlab("Year")+ylab("Rank")+
  ggtitle("Rank of Sri Lanka Changing from 1996 to 2017")+
  theme(axis.text.x =element_text(angle = 45, hjust = 1))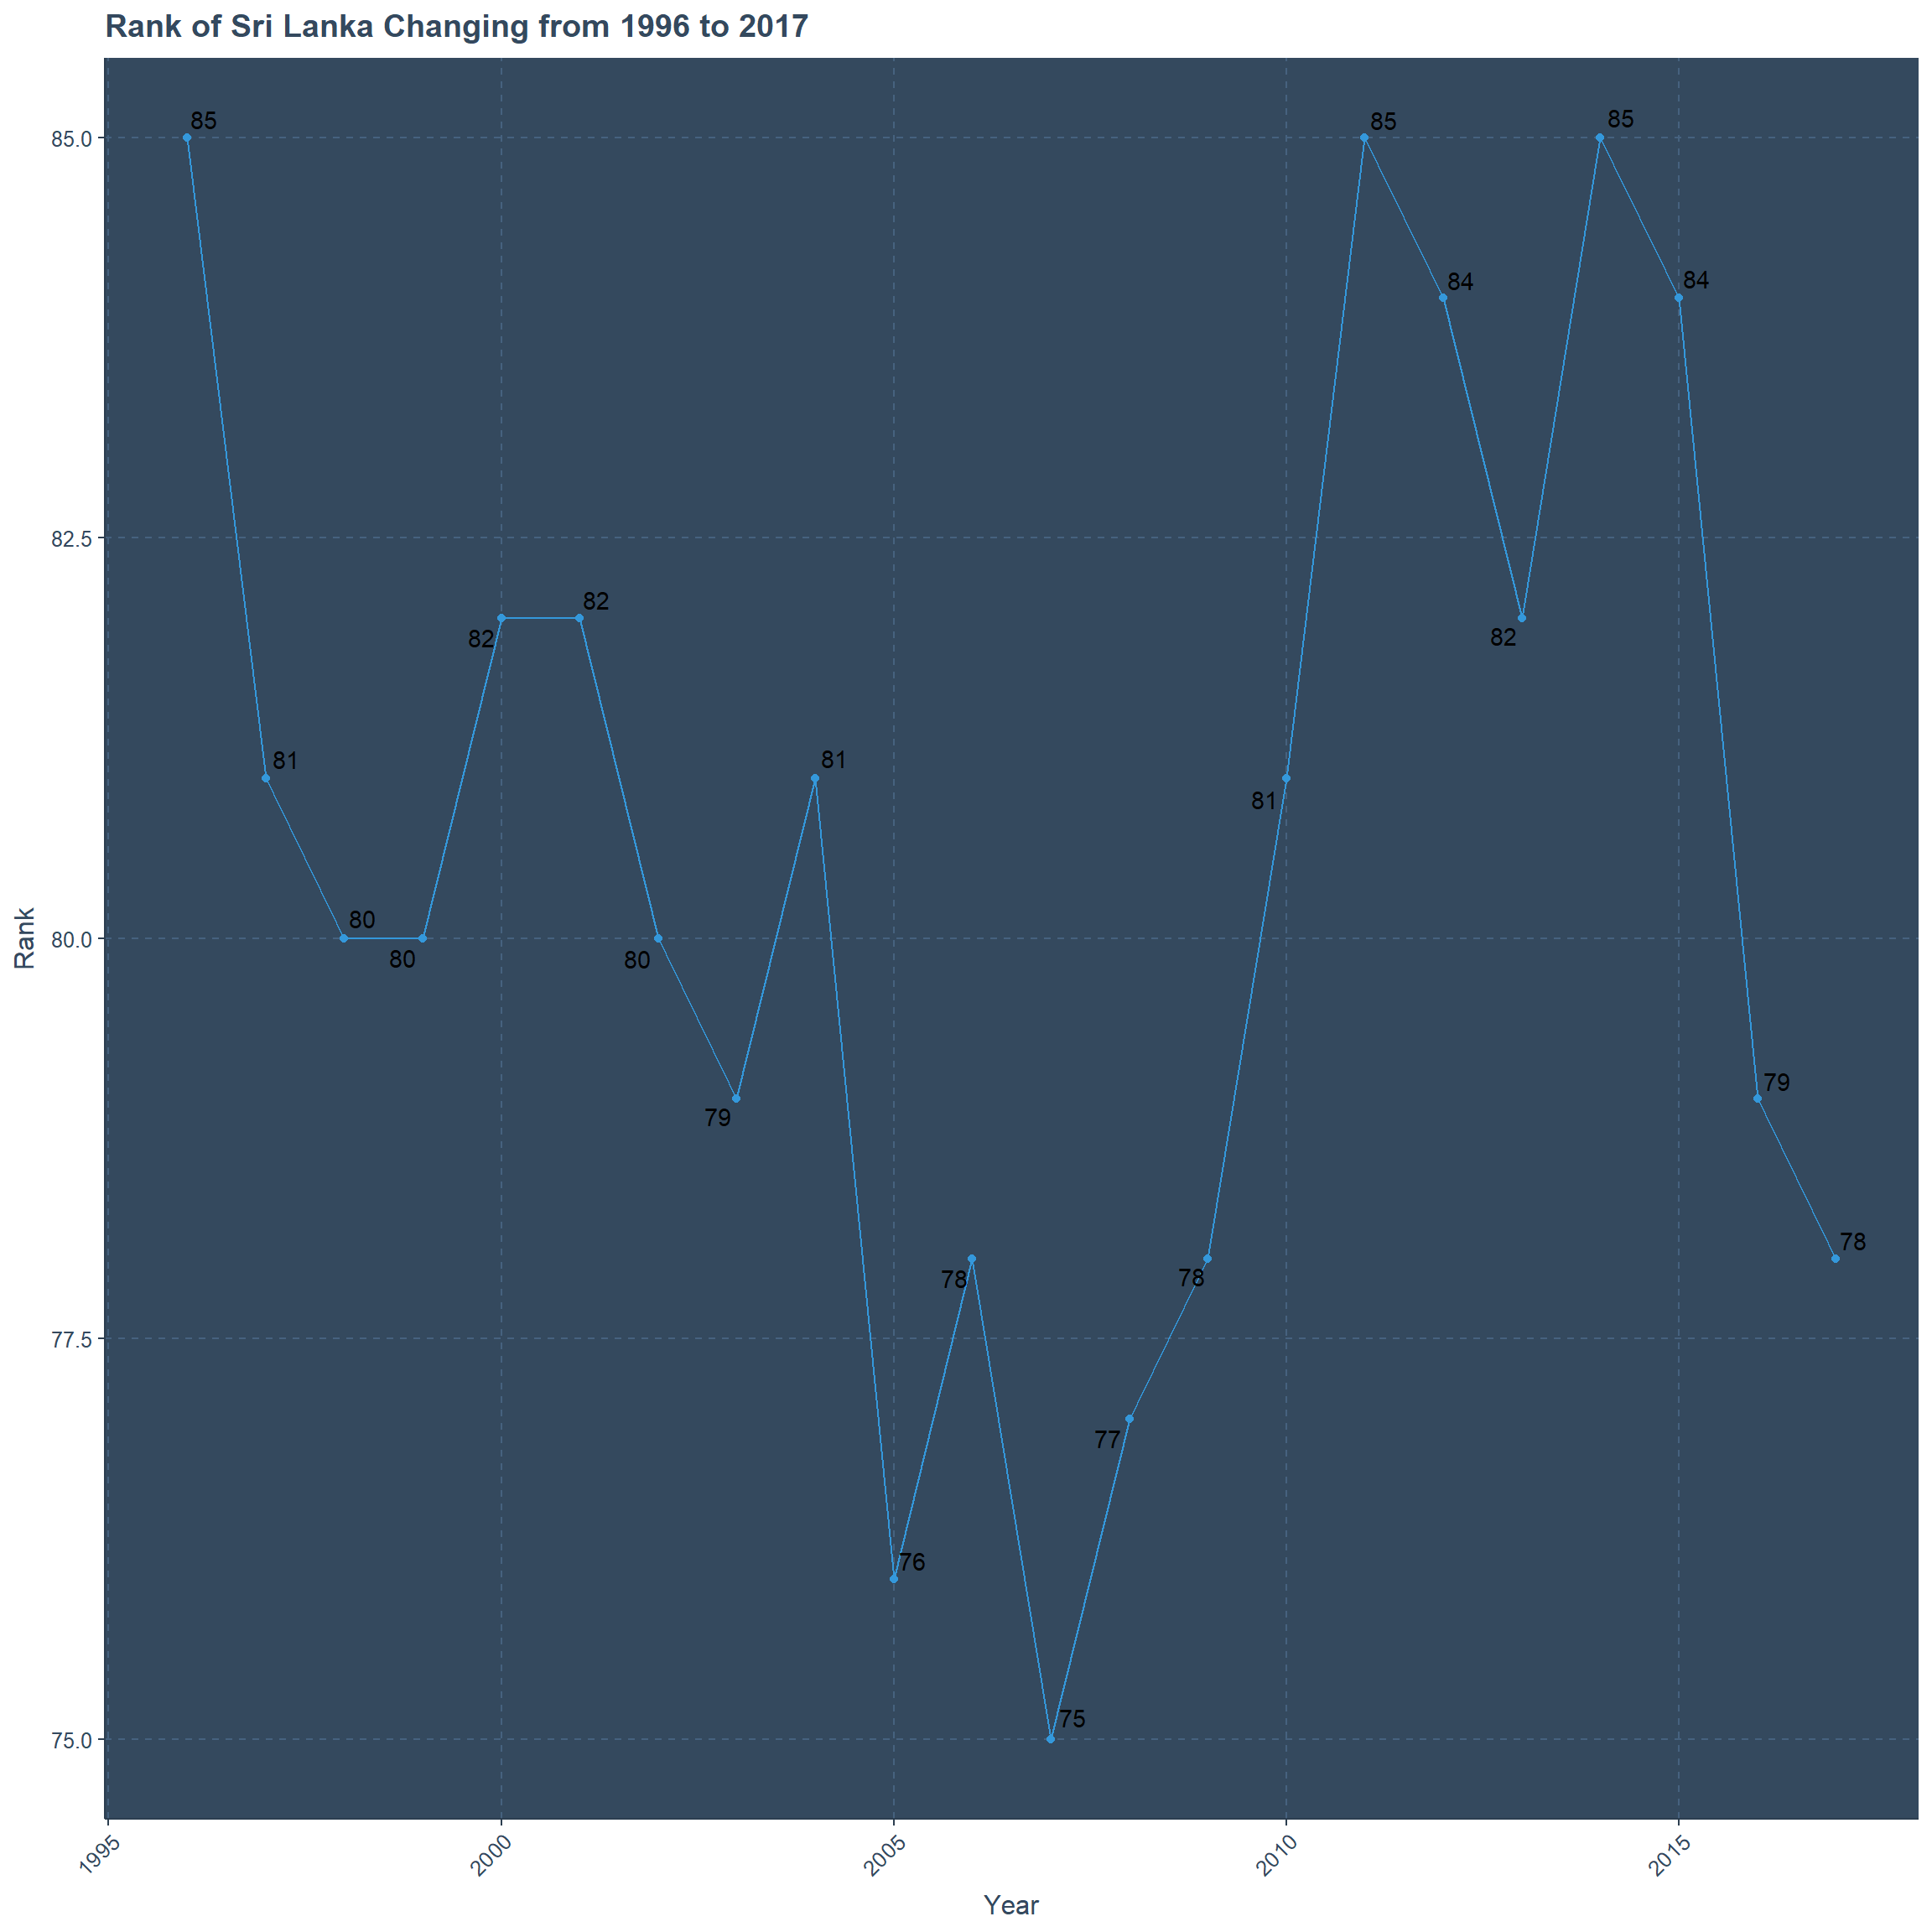
Ranking of South Asian Region Countries from 1996 to 2017
India is way ahead of other seven countries in the South Asian region where it has gradually moved from 13th position to 5th over the years. Sri Lanka is currently behind India, Pakistan and Nepal.
Further Bhutan, Maldives and Afghanistan have ranks above 130 for the period of time given, while Maldives has stayed in the range of 213 and 167. Afghanistan and Bhutan have made improvements where now(2017) they are holding ranks of 136 and 159 respectively while in 1996 they had ranks of 207 and 186. These three countries tend to oscillate very frequently among ranks than the other 5 countries in the region.
subset(sjr_countries,
       country =="Sri Lanka" | country=="India"| country=="Pakistan"|
       country =="Nepal" | country== "Maldives" | country =="Afghanistan"|
       country == "Bhutan" | country=="Bangladesh") %>%
       mutate(year=year(as.Date(year,"%Y"))) %>%
ggplot(.,aes(x=year,y=rank,label=rank,color=country))+
  geom_point()+geom_line()+
  geom_text_repel()+
  xlab("Year")+ylab("Rank")+
  ggtitle("Rank of South Asian Region Changing from 1996 to 2017")+
  theme(axis.text.x =element_text(angle = 45, hjust = 1))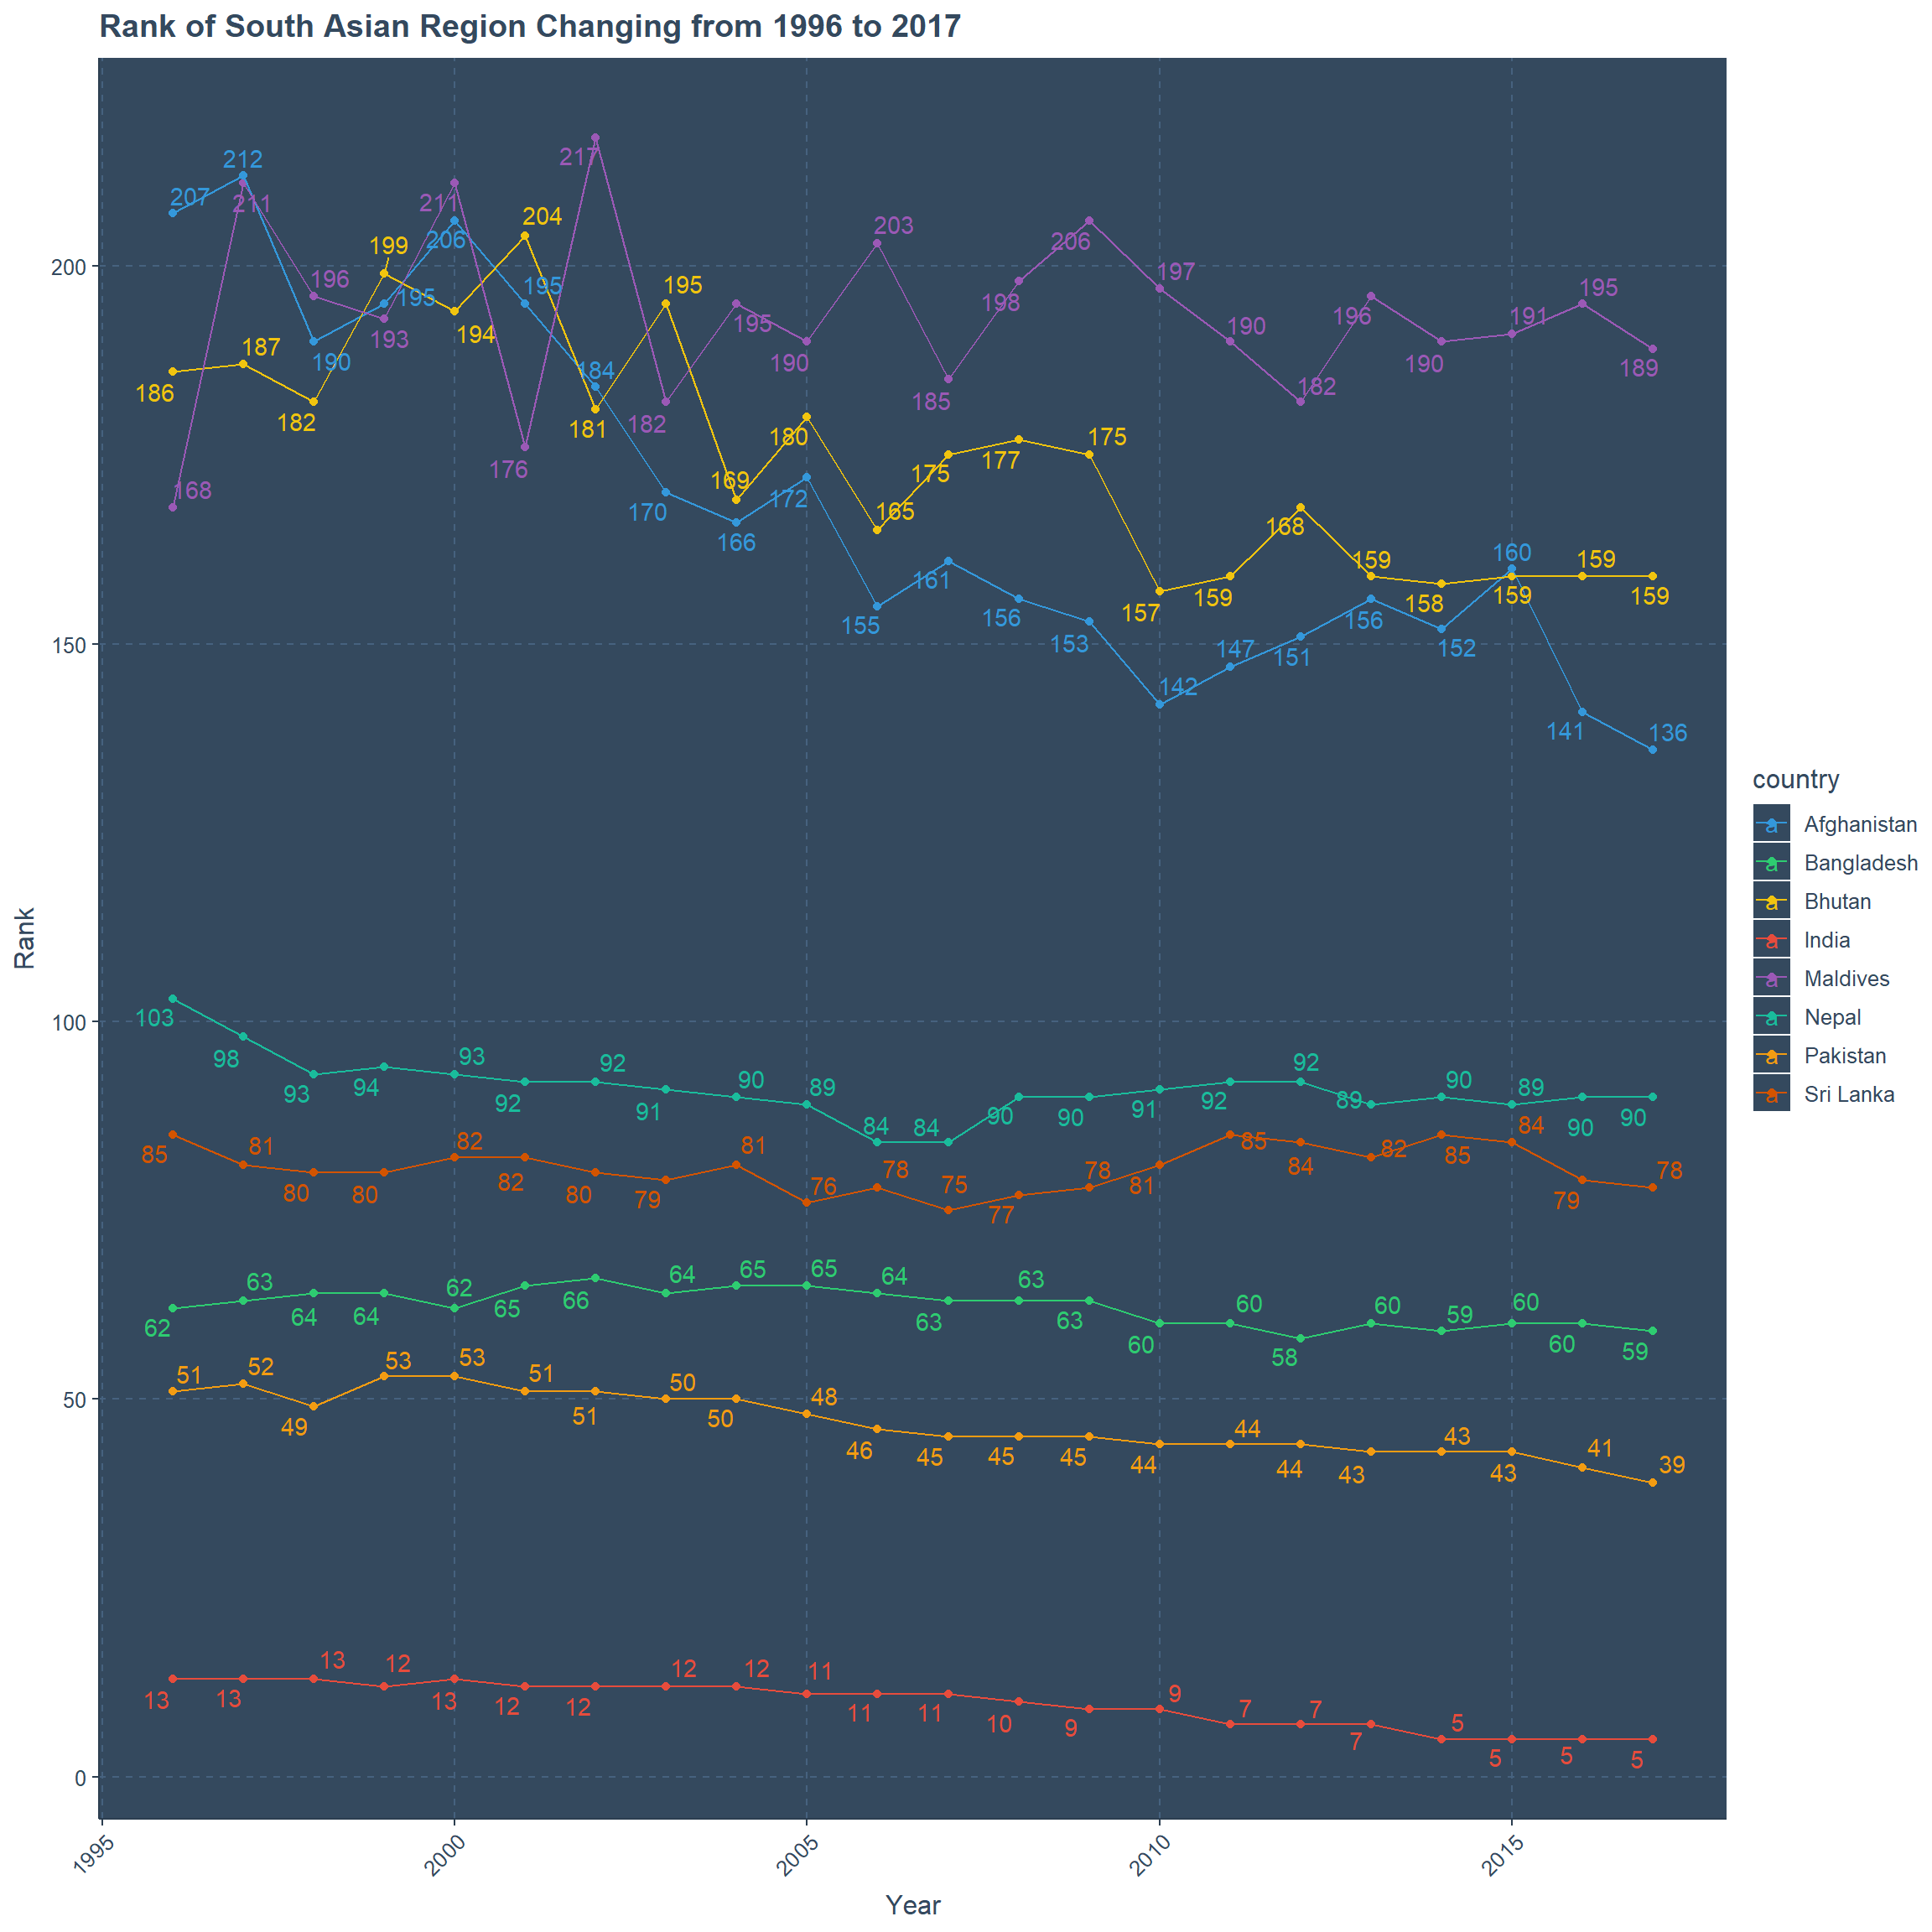
Documents , Citable Documents and Self Citations from Sri Lanka Journals
Over the years Self citations were higher than citable documents and documents in counts, but this is not the case after the year 2012. Self citations reached its highest peak of 1331 in 2012 but in the next few years they gradually decreased to 175 counts in year 2017. Even though in 1996 the self citations count was 275 which is higher than current counts in 2017 for self citation.
This is not the case for citable documents and documents where they start with counts of close to 200. Over the years they rapidly increase and reach the close to thousand mark 2012. This form of improvement continues further and reaches the close to two thousand mark in the year 2017, which I feel is impressive. The gap between documents and citable documents is very thin in the early 2000s but while counts increase the gap also considerably increases.
sjr_countries%>%
  gather(citing,values,"documents","citable_documents","self_citations") %>%
  subset(country=="Sri Lanka",select=c(citing,values,year)) %>%
  mutate(year=year(as.Date(year,"%Y"))) %>%
ggplot(.,aes(x=year,y=values,label=values,color=citing,shape=citing))+
  geom_point()+geom_line()+
  geom_text_repel()+
  xlab("Year")+ylab("Counts")+
  scale_x_continuous(breaks=seq(1996,2017),labels=seq(1996,2017))+
  scale_y_continuous(breaks=seq(0,2000,100),labels=seq(0,2000,100))+
  ggtitle("Document Counts Changing from 1996 to 2017 for Sri Lanka")+
  theme(axis.text.x =element_text(angle = 90, hjust = 1))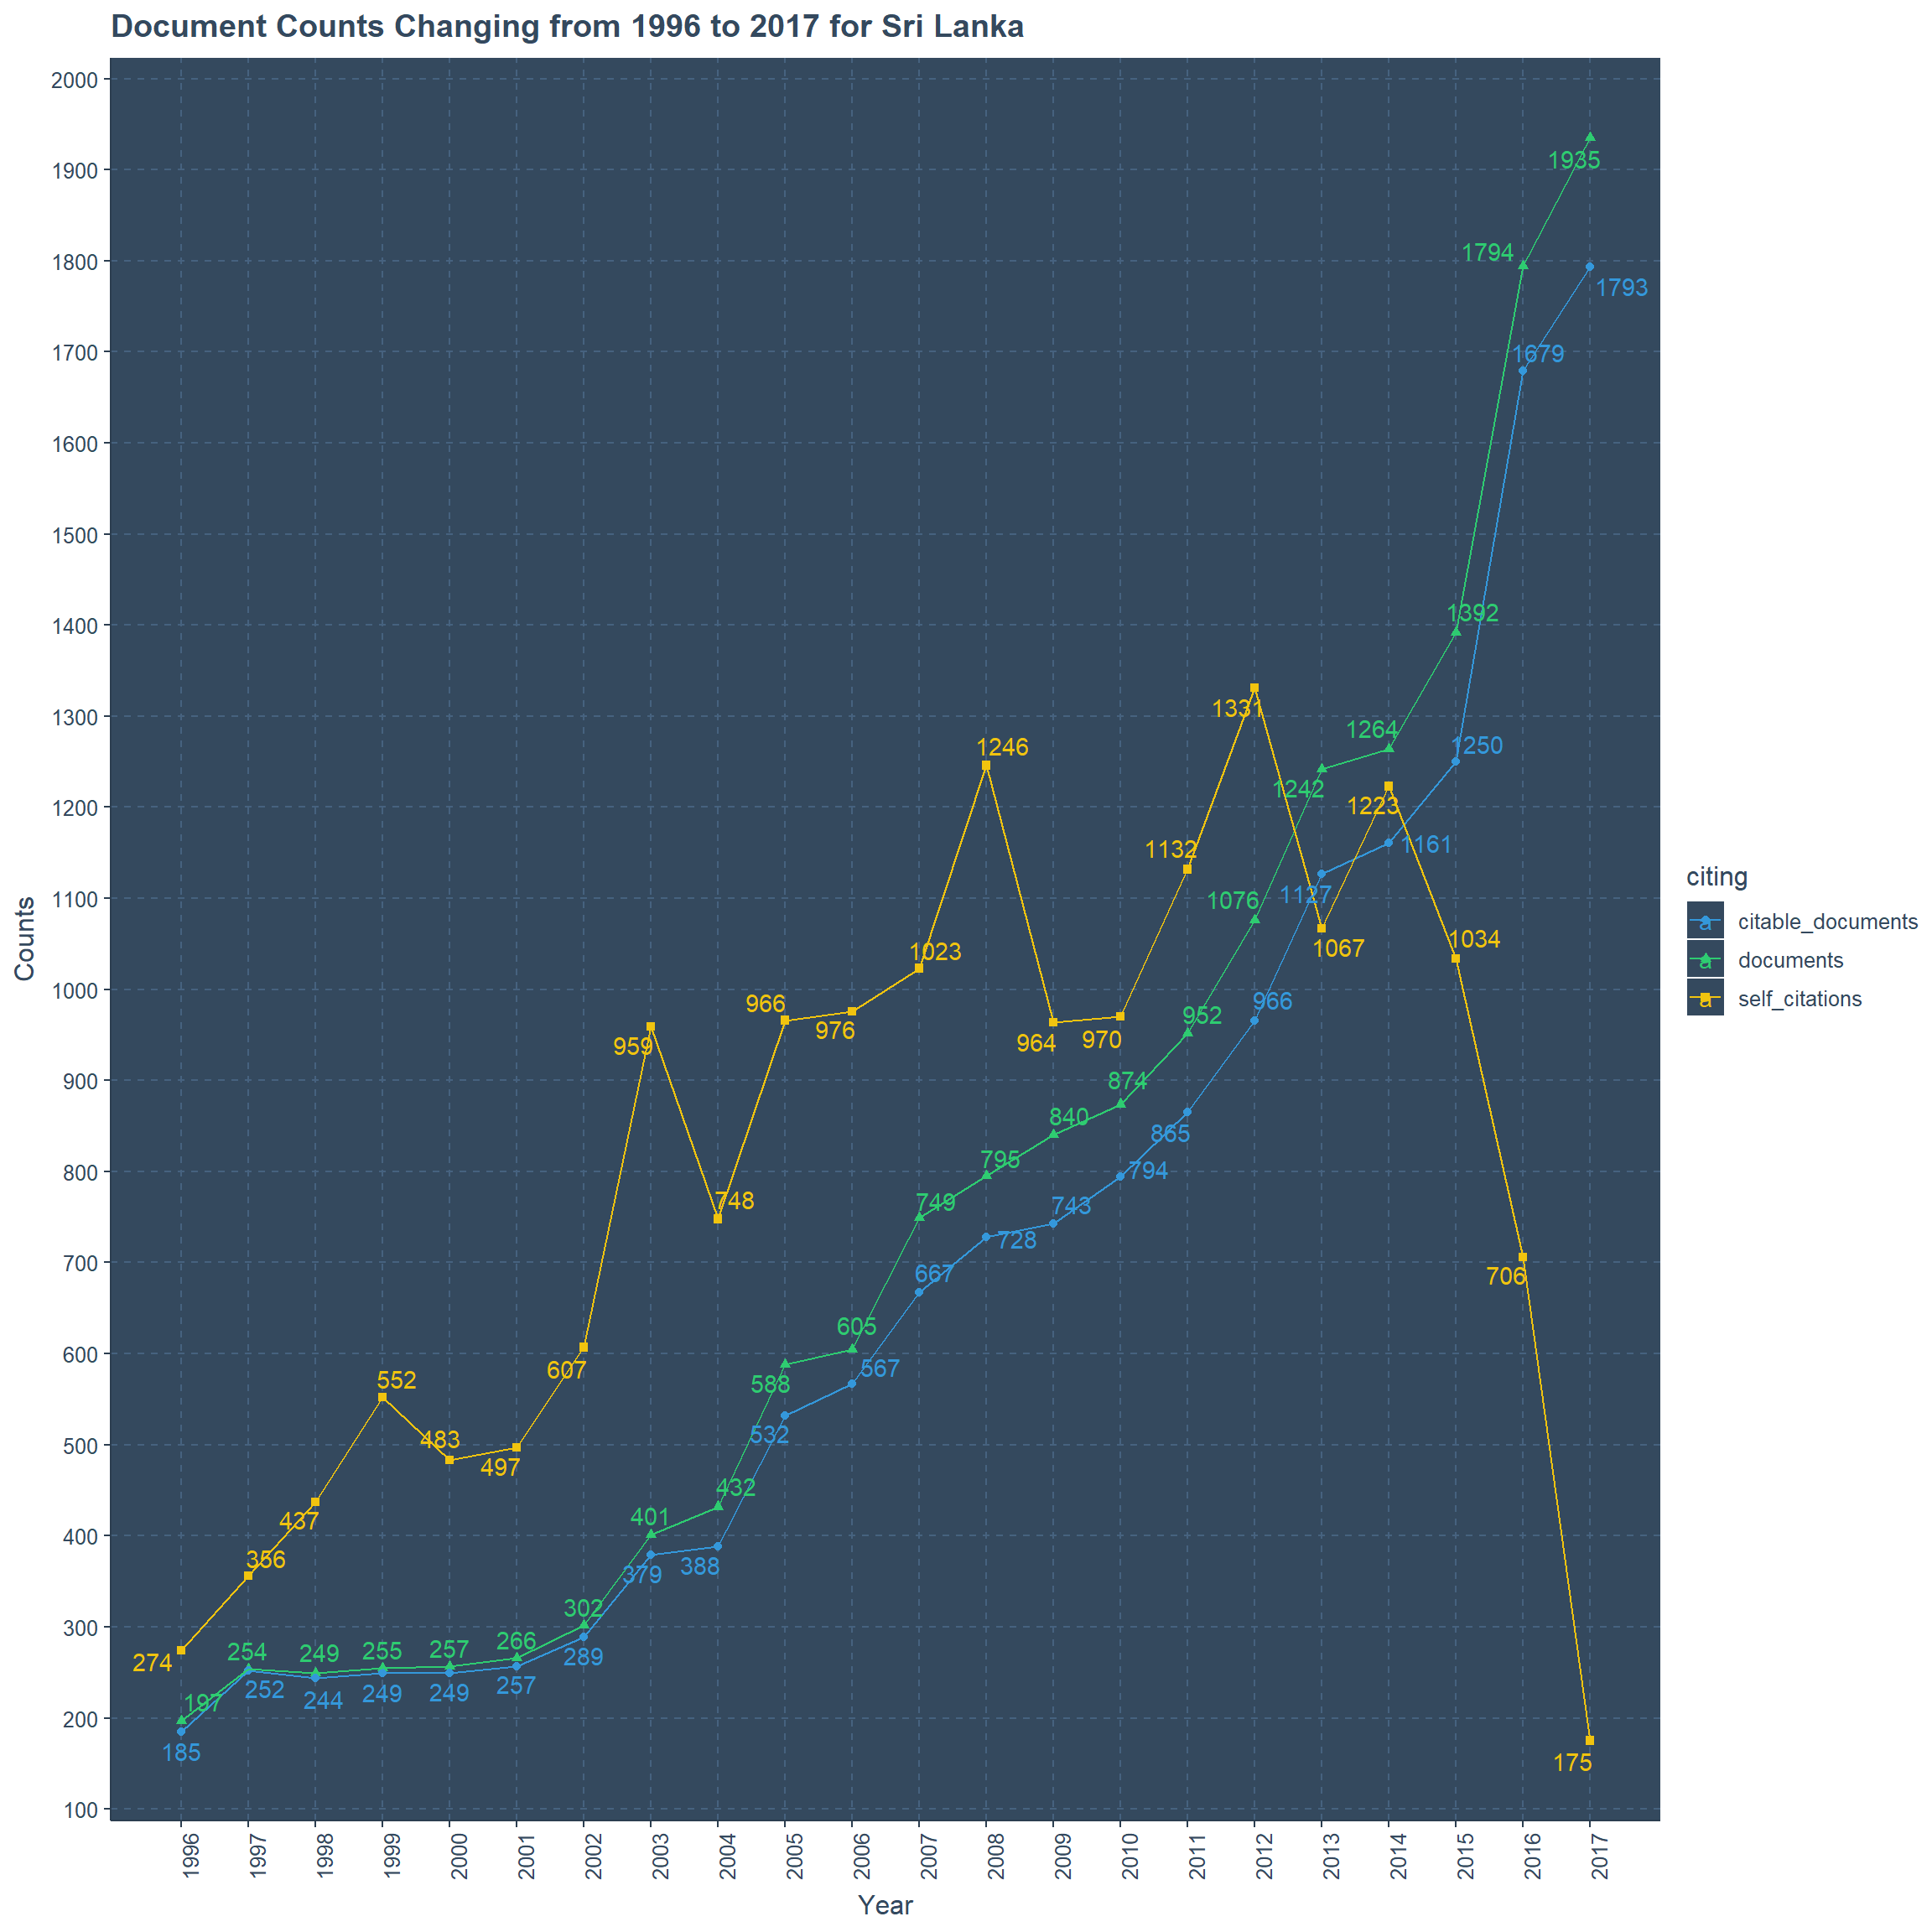
Citations per Document from Sri Lankan Journals
Citations per document has a steady rise from 14.28 to 24.29 in the years of 1996 to 2000, while there is a sudden decline next year it manages to increases and reach the peak point of 29.29 in year 2003. After the millenium we can clearly see a clear steep in numbers over the next two decades, where now in year 2017 the citations per document has dropped to 0.61. It is very alarming even though we have alot of citable documents in the same year according to the previous plot.
sjr_countries %>%
   subset(country=="Sri Lanka") %>%
   mutate(year=year(as.Date(year,"%Y"))) %>%
ggplot(.,aes(x=year,y=citations_per_document,
          label=citations_per_document))+
  geom_point()+geom_line()+
  geom_text_repel()+
  xlab("Year")+ylab("Citations Per Document")+
  scale_x_continuous(breaks=seq(1996,2017),labels=seq(1996,2017))+
  scale_y_continuous(breaks=seq(0,30),labels=seq(0,30))+
  ggtitle("Citations Per Document from 1996 to 2017 for Sri Lanka")+
  theme(axis.text.x =element_text(angle = 90, hjust = 1))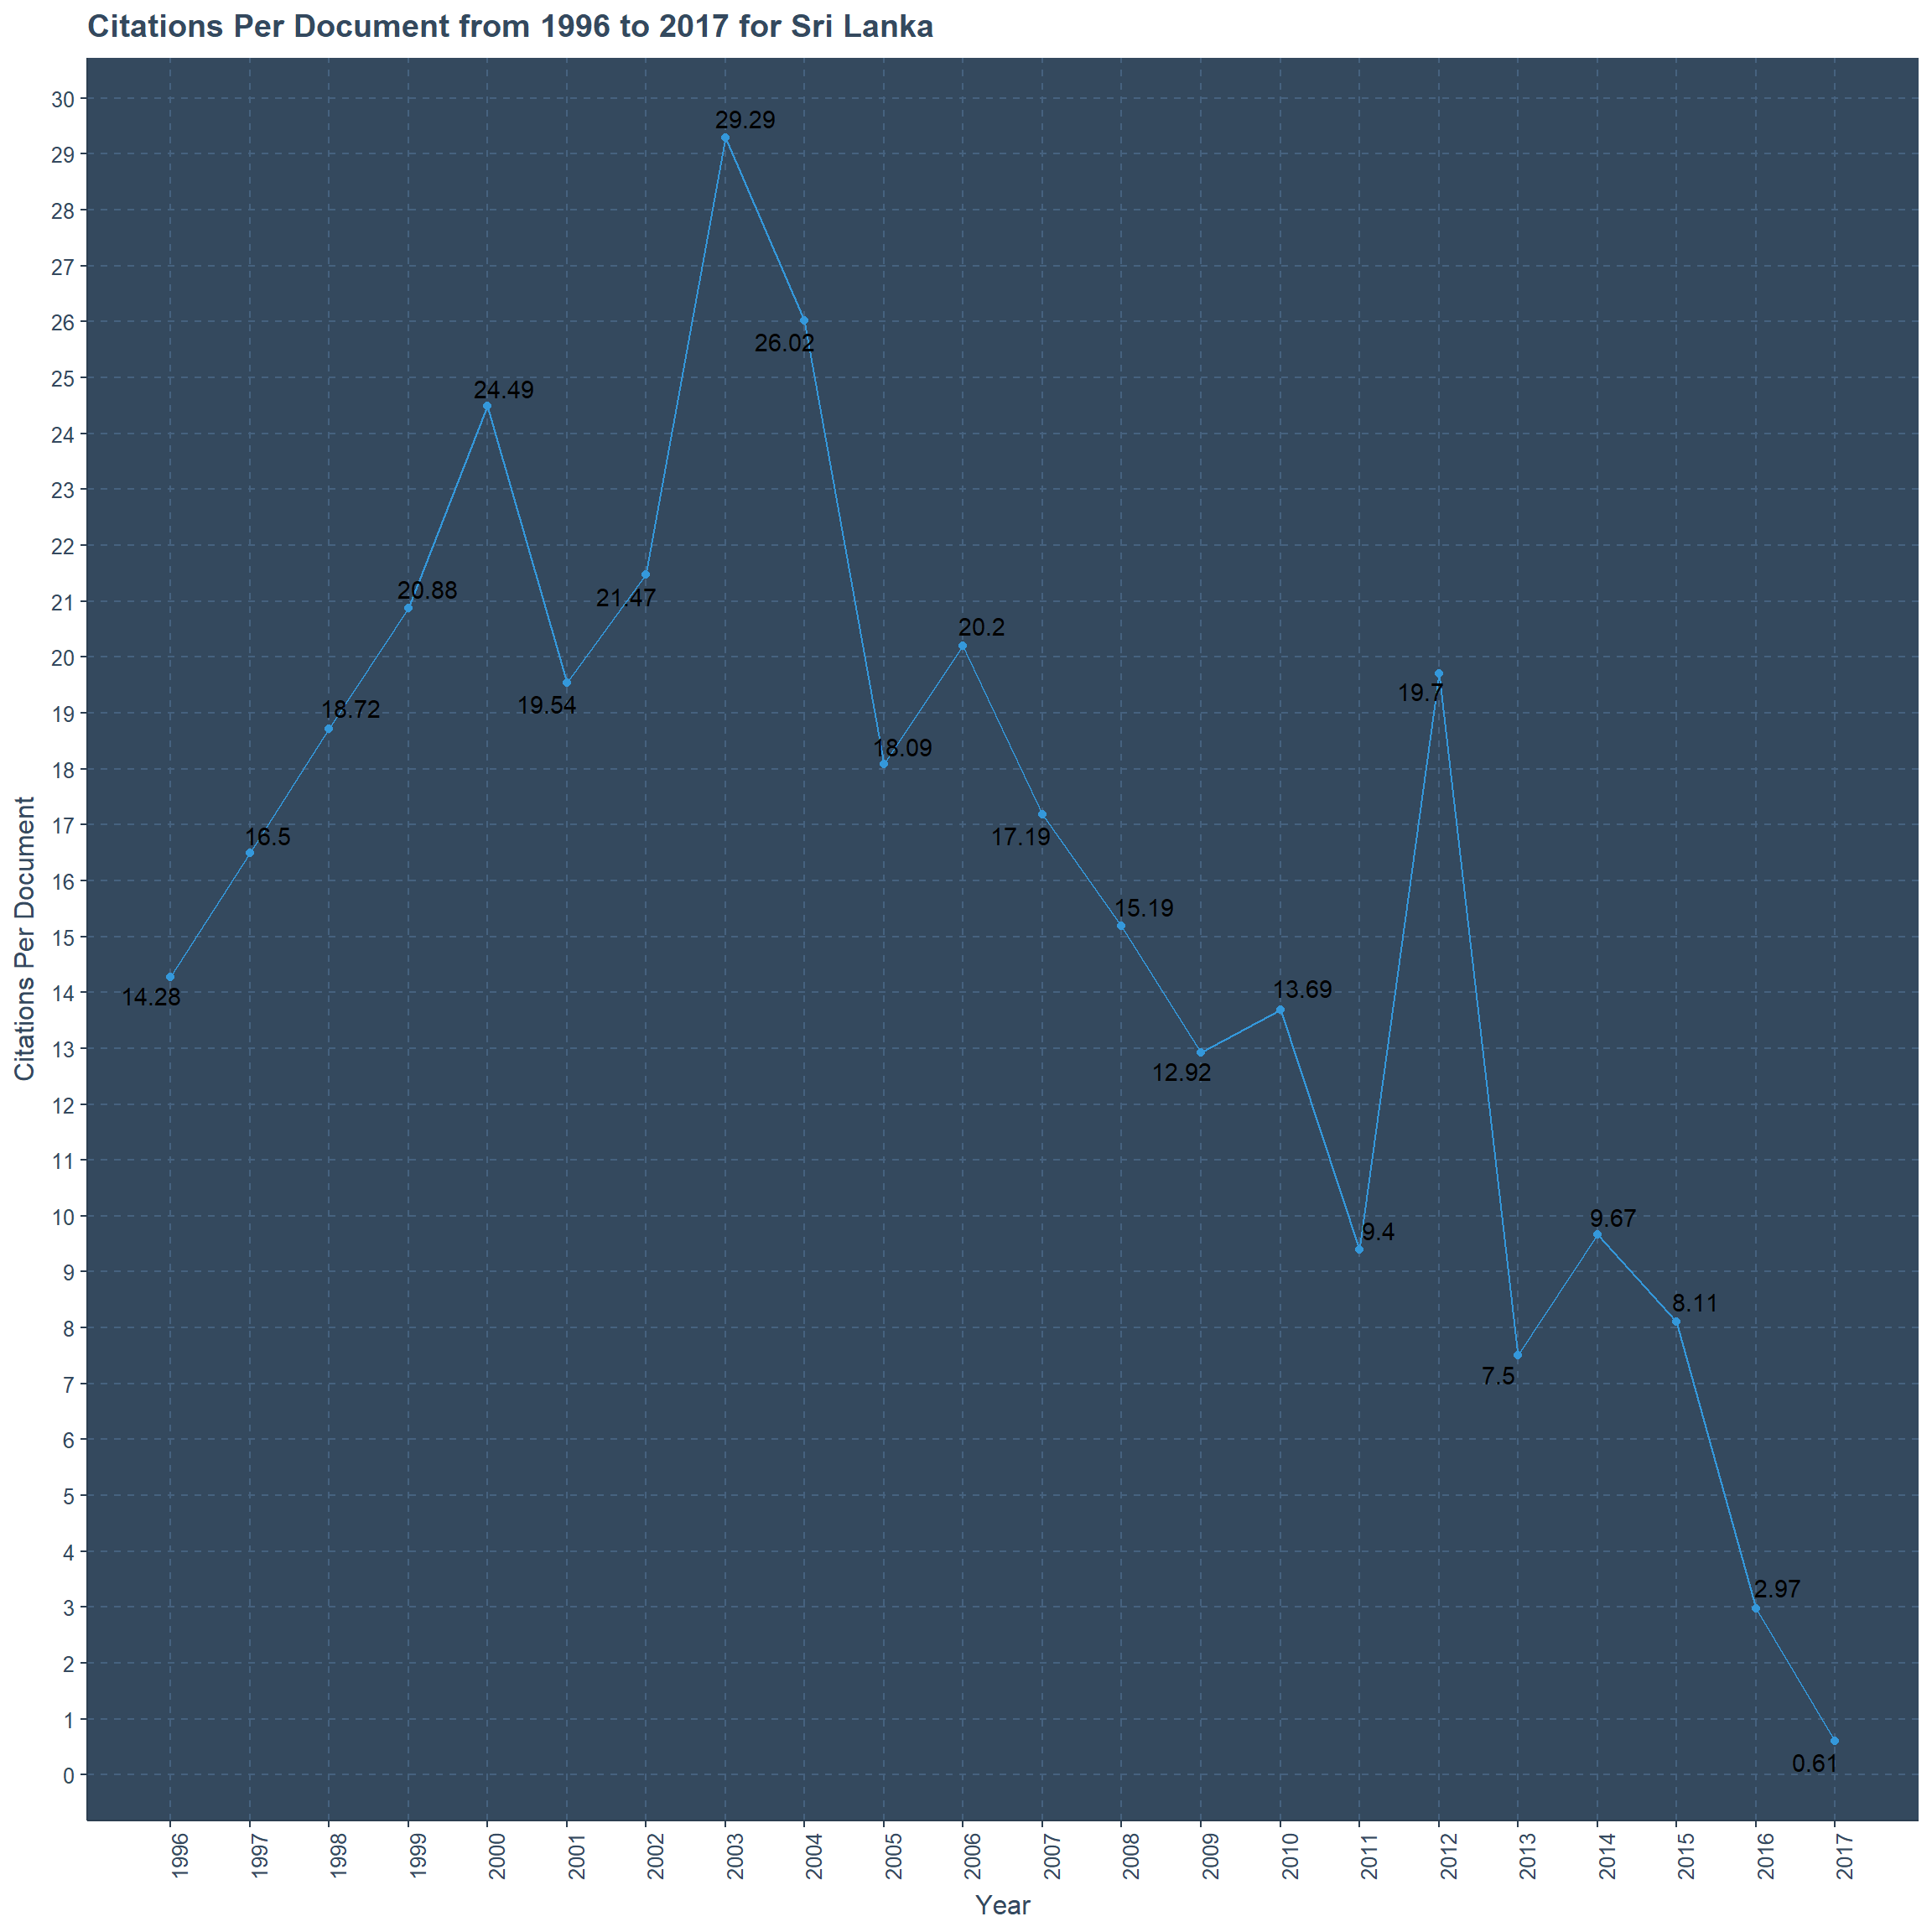
Journals from Sri Lanka
9 titles are listed and considered here from Sri Lanka where some began publishing recently.
Rank changes for Sri Lankan Journals
Journals which started close to year 2000 have ranks close to ten thousand, while recent publications has ranks leading upto the rank of higher than thirty thousand as well. Journal of the National Science Foundation of Sri Lanka and Ceylon Medical Journal has published more than other publications and they do have better rankings through out the years.
p<-subset(sjr_journals,country=="Sri Lanka") %>%
   mutate(year=year(as.Date(year,"%Y"))) %>%
   ggplot(.,aes(x=str_wrap(factor(title),30),y=rank,color=year))+
         geom_jitter()+coord_flip()+
         shadow_mark()+
         transition_time(year)+ease_aes("linear")+
         xlab("Title of Journals")+ylab("Rank")+
         ggtitle("Ranks Changing over time for Sri Lankan Journals from 1999 to 2017",
                 subtitle = "Year : {round(frame_time)}")

animate(p,fps=1,nframes=18) 
SJR values changing for Sri Lankan Journals
p<-subset(sjr_journals,country=="Sri Lanka") %>%
   mutate(year=year(as.Date(year,"%Y"))) %>%
   ggplot(.,aes(x=str_wrap(factor(title),30),y=sjr,color=year,shape=sjr_best_quartile))+
         geom_jitter()+coord_flip()+
         shadow_mark()+
         labs(shape="SJR Best Q")+
         transition_time(year)+ease_aes("linear")+
         xlab("Title of Journals")+ylab("SJR values")+
         ggtitle("SJR values Changing over time for Sri Lankan Journals from 1999 to 2017",
                 subtitle = "Year : {round(frame_time)}")+
         theme(legend.position = "bottom")

animate(p,fps=1,nframes=18) 
References per Document changing for Sri Lankan Journals
Highest amount of reference per document is close to 100 while the minimum is close to zero. There is no specific pattern over the years which indicate an increase or decrease.
p<-subset(sjr_journals,country=="Sri Lanka") %>%
   mutate(year=year(as.Date(year,"%Y"))) %>%
   ggplot(.,aes(x=str_wrap(factor(title),30),y=ref_doc,color=year))+
         geom_jitter()+coord_flip()+
         shadow_mark()+
         transition_time(year)+ease_aes("linear")+
         xlab("Title of Journals")+ylab("References per Document")+
         ggtitle("References per Document Changing over time for Sri Lankan Journals from 1999 to 2017",
                 subtitle = "Year : {round(frame_time)}")

animate(p,fps=1,nframes=18) 
Publishers and Journals from Sri Lanka
Without any hesitation I could say most of these publications are from the field of medicine and institutions related to medicine. There are some publishers such as Internations Centre for Ethnic Studies and International Irrigation Managament Institue, but they have published very few publications.
p<-subset(sjr_journals,country=="Sri Lanka") %>%
   mutate(year=year(as.Date(year,"%Y"))) %>%
   ggplot(.,aes(x=str_wrap(factor(title),30),y=str_wrap(factor(publisher),30),color=year))+
   geom_jitter()+
   transition_time(year)+ease_aes("linear")+
   shadow_mark()+
   xlab("Title")+ylab("Publisher")+
   theme(axis.text.x =element_text(angle = 90, hjust = 1))+
   ggtitle("Title and Publishers changing over time for Sri Lankan Journals from 1999 to 2017",
           subtitle = "Year : {round(frame_time)}")

animate(p,fps=1,nframes=18) 
Total Documents and References for Journals from Sri Lanka
The Gaps between Total documents per year and Total references are compared here. Obviously in most of the cases Total documents per year is very low considering to Total references. There are anomalies such as Ceylon Medical Journal but only in the earlier publications.
p<-sjr_journals %>%
    gather(Group,values,"total_docs_year","total_refs") %>%
    subset(country=="Sri Lanka",select=c(Group,values,year,title)) %>%
    mutate(year=year(as.Date(year,"%Y"))) %>%
ggplot(.,aes(x=str_wrap(factor(title),30),y=values,fill=Group,group=Group))+
      geom_col(position = "dodge")+
      coord_flip()+
      xlab("Title")+ylab("Count")+
      transition_time(year)+ease_aes("linear")+
      ggtitle("Counts changing for Sri Lankan Journals from 1999 to 2017",
              subtitle = "Year : {round(frame_time)}")+
      theme(legend.position="bottom")

animate(p,nframes=18,fps=1)
Three year time period for Journals from Sri Lanka
p<-sjr_journals %>%
    gather(Group,values,"total_docs_3years","total_cites_3years","citable_docs_3years") %>%
    subset(country=="Sri Lanka",select=c(Group,values,year,title)) %>%
    mutate(year=year(as.Date(year,"%Y"))) %>%
ggplot(.,aes(x=str_wrap(factor(title),30),y=values,fill=Group,group=Group))+
      geom_col(position="dodge")+coord_flip()+
      xlab("Title")+ylab("Count for 3 years")+
      transition_time(year)+ease_aes("linear")+
      ggtitle("Counts changing for Sri Lankan Journals from 1999 to 2017",
              subtitle = "Year : {round(frame_time)}")+
      theme(legend.position="bottom")

animate(p,nframes=18,fps=1)
Journals and categories
p<-sjr_journals %>%
      subset(country=="Sri Lanka") %>%
      select(year,title,categories) %>%
      cSplit("categories",sep=";") %>%
      gather(Groups,Categories,"categories_1","categories_2","categories_3","categories_4") %>%
      mutate(Categories=genX(Categories,"(Q",")")) %>%
      mutate(year=year(as.Date(year,"%Y"))) %>%
ggplot(.,aes(x=str_wrap(factor(title),30),y=str_wrap(Categories,30),shape=Groups,color=year)) +
      geom_jitter()+
      theme(axis.text.x =element_text(angle = 90, hjust = 1),
            legend.position="bottom")+
      transition_time(year)+ease_aes("linear")+
      xlab("Title")+ ylab("Categories")+shadow_mark()+
      ggtitle("Title and Categories between the years 1999 to 2017",
              subtitle="Year :{round(frame_time)}")

animate(p,nframes=18,fps=1) 
THANK YOU