
# load the packages
library(readr)
library(tidyverse)
library(ggalt)
library(magrittr)
library(dplyr)
library(ggthemr)
library(gganimate)

# Load the Agency data
agencies<-read_csv("agencies.csv")

# Load the Launches data
launches<-read_csv("launches.csv")

attach(agencies)
attach(launches)

# load a theme
ggthemr("flat dark")
AGENCIES
Space related agencies of 74 are in the world from this data set. Another, data set is for launches from the agencies in concern. In the agencies data set there are 19 variables and launches data set has 11 variables. You can find the data set and information regarded to it here.
Early years of space launches had more mistakes and they were owned by the state. After the cold war, there is short of enthusiasm, but now we have an increase in launches. Code: https://t.co/R0BLjFOH4U #tidytuesday pic.twitter.com/6dX338hpPD
— Amalan Mahendran (@Amalan_Con_Stat) January 16, 2019
Agency vs Count
Most amount of launches are from Rakentiye Voiska Strategicheskogo Naznacheniye (RVSN) and it is 1528 and next is Upravleniye Nachalnika Kosmicheskikh Sredstv (UNKS) with 904. Out of the Top 10 places (considering the most launches) it is clear that class D agencies has the most amount (of 5),while 3 from class C agencies and the rest with class B. NASA is in third place with 469 launches and it is a class C agency. My favorite agency Space X (SPX) has launched 65 times and it is a class B agency.
ggplot(agencies,aes(x=fct_inorder(agency),y=count,
                    color=class,fill=class))+
       geom_bar(stat="identity",width=0.75)+coord_flip()+
       geom_text(label=agencies$count, hjust=-0.15)+
       xlab("Space Agency")+ylab("Frequency")+
       ggtitle("Space Agency vs Frequency By Class")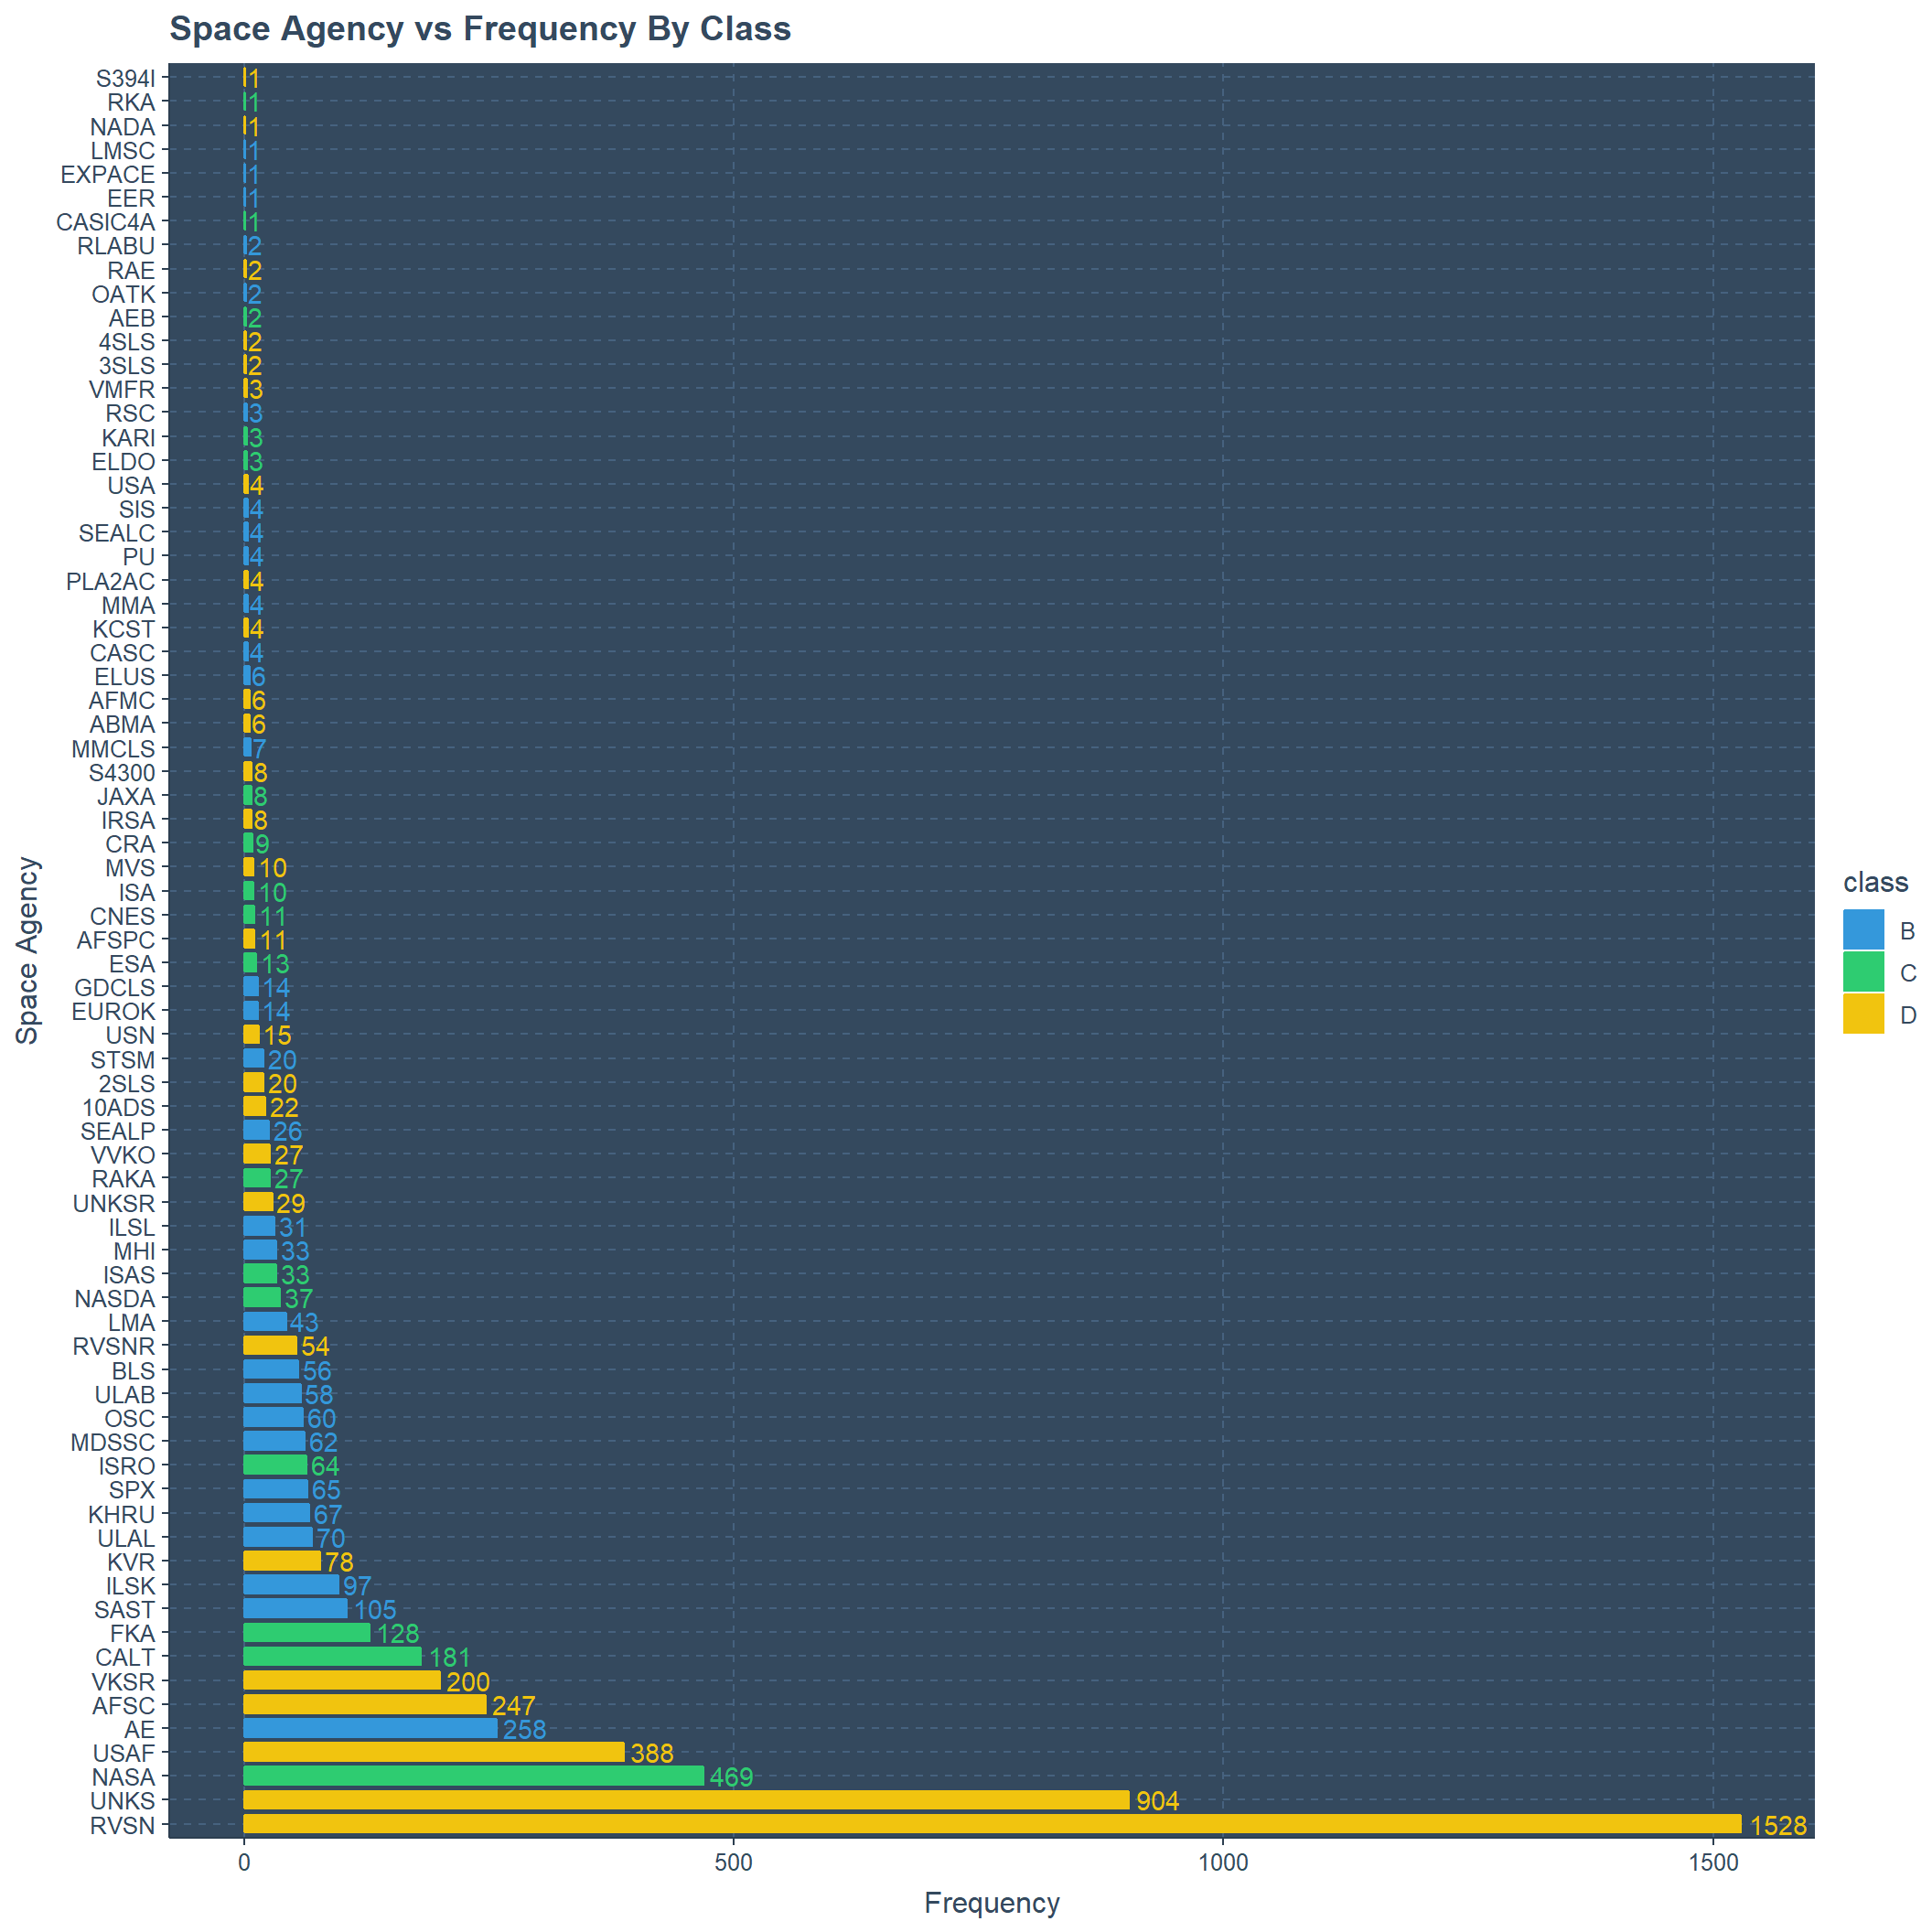
Similarly, for the same bar plot if we change color according to agency type we have different insight. Top 10 agencies is 90% filled with state ownership and 10% is with private ownership. It should be noted that overall there are only two start-ups and close to 10 have private ownership, rest is state owned. The highest amount of launches for a private ownership is from Arian Space(AE) and for start-up its Space X (SPX). Respectively, their counts are 258 and 65.
ggplot(agencies,aes(x=fct_inorder(agency),y=count,
                    color=agency_type,fill=agency_type))+
       geom_bar(stat="identity",width=0.75)+coord_flip()+
       geom_text(aes(label=count), hjust=-0.15)+
       xlab("Space Agency")+ylab("Frequency")+
      labs(color="Agency Type",fill="Agency Type")+
      ggtitle("Space Agency vs Frequency By Agency Type")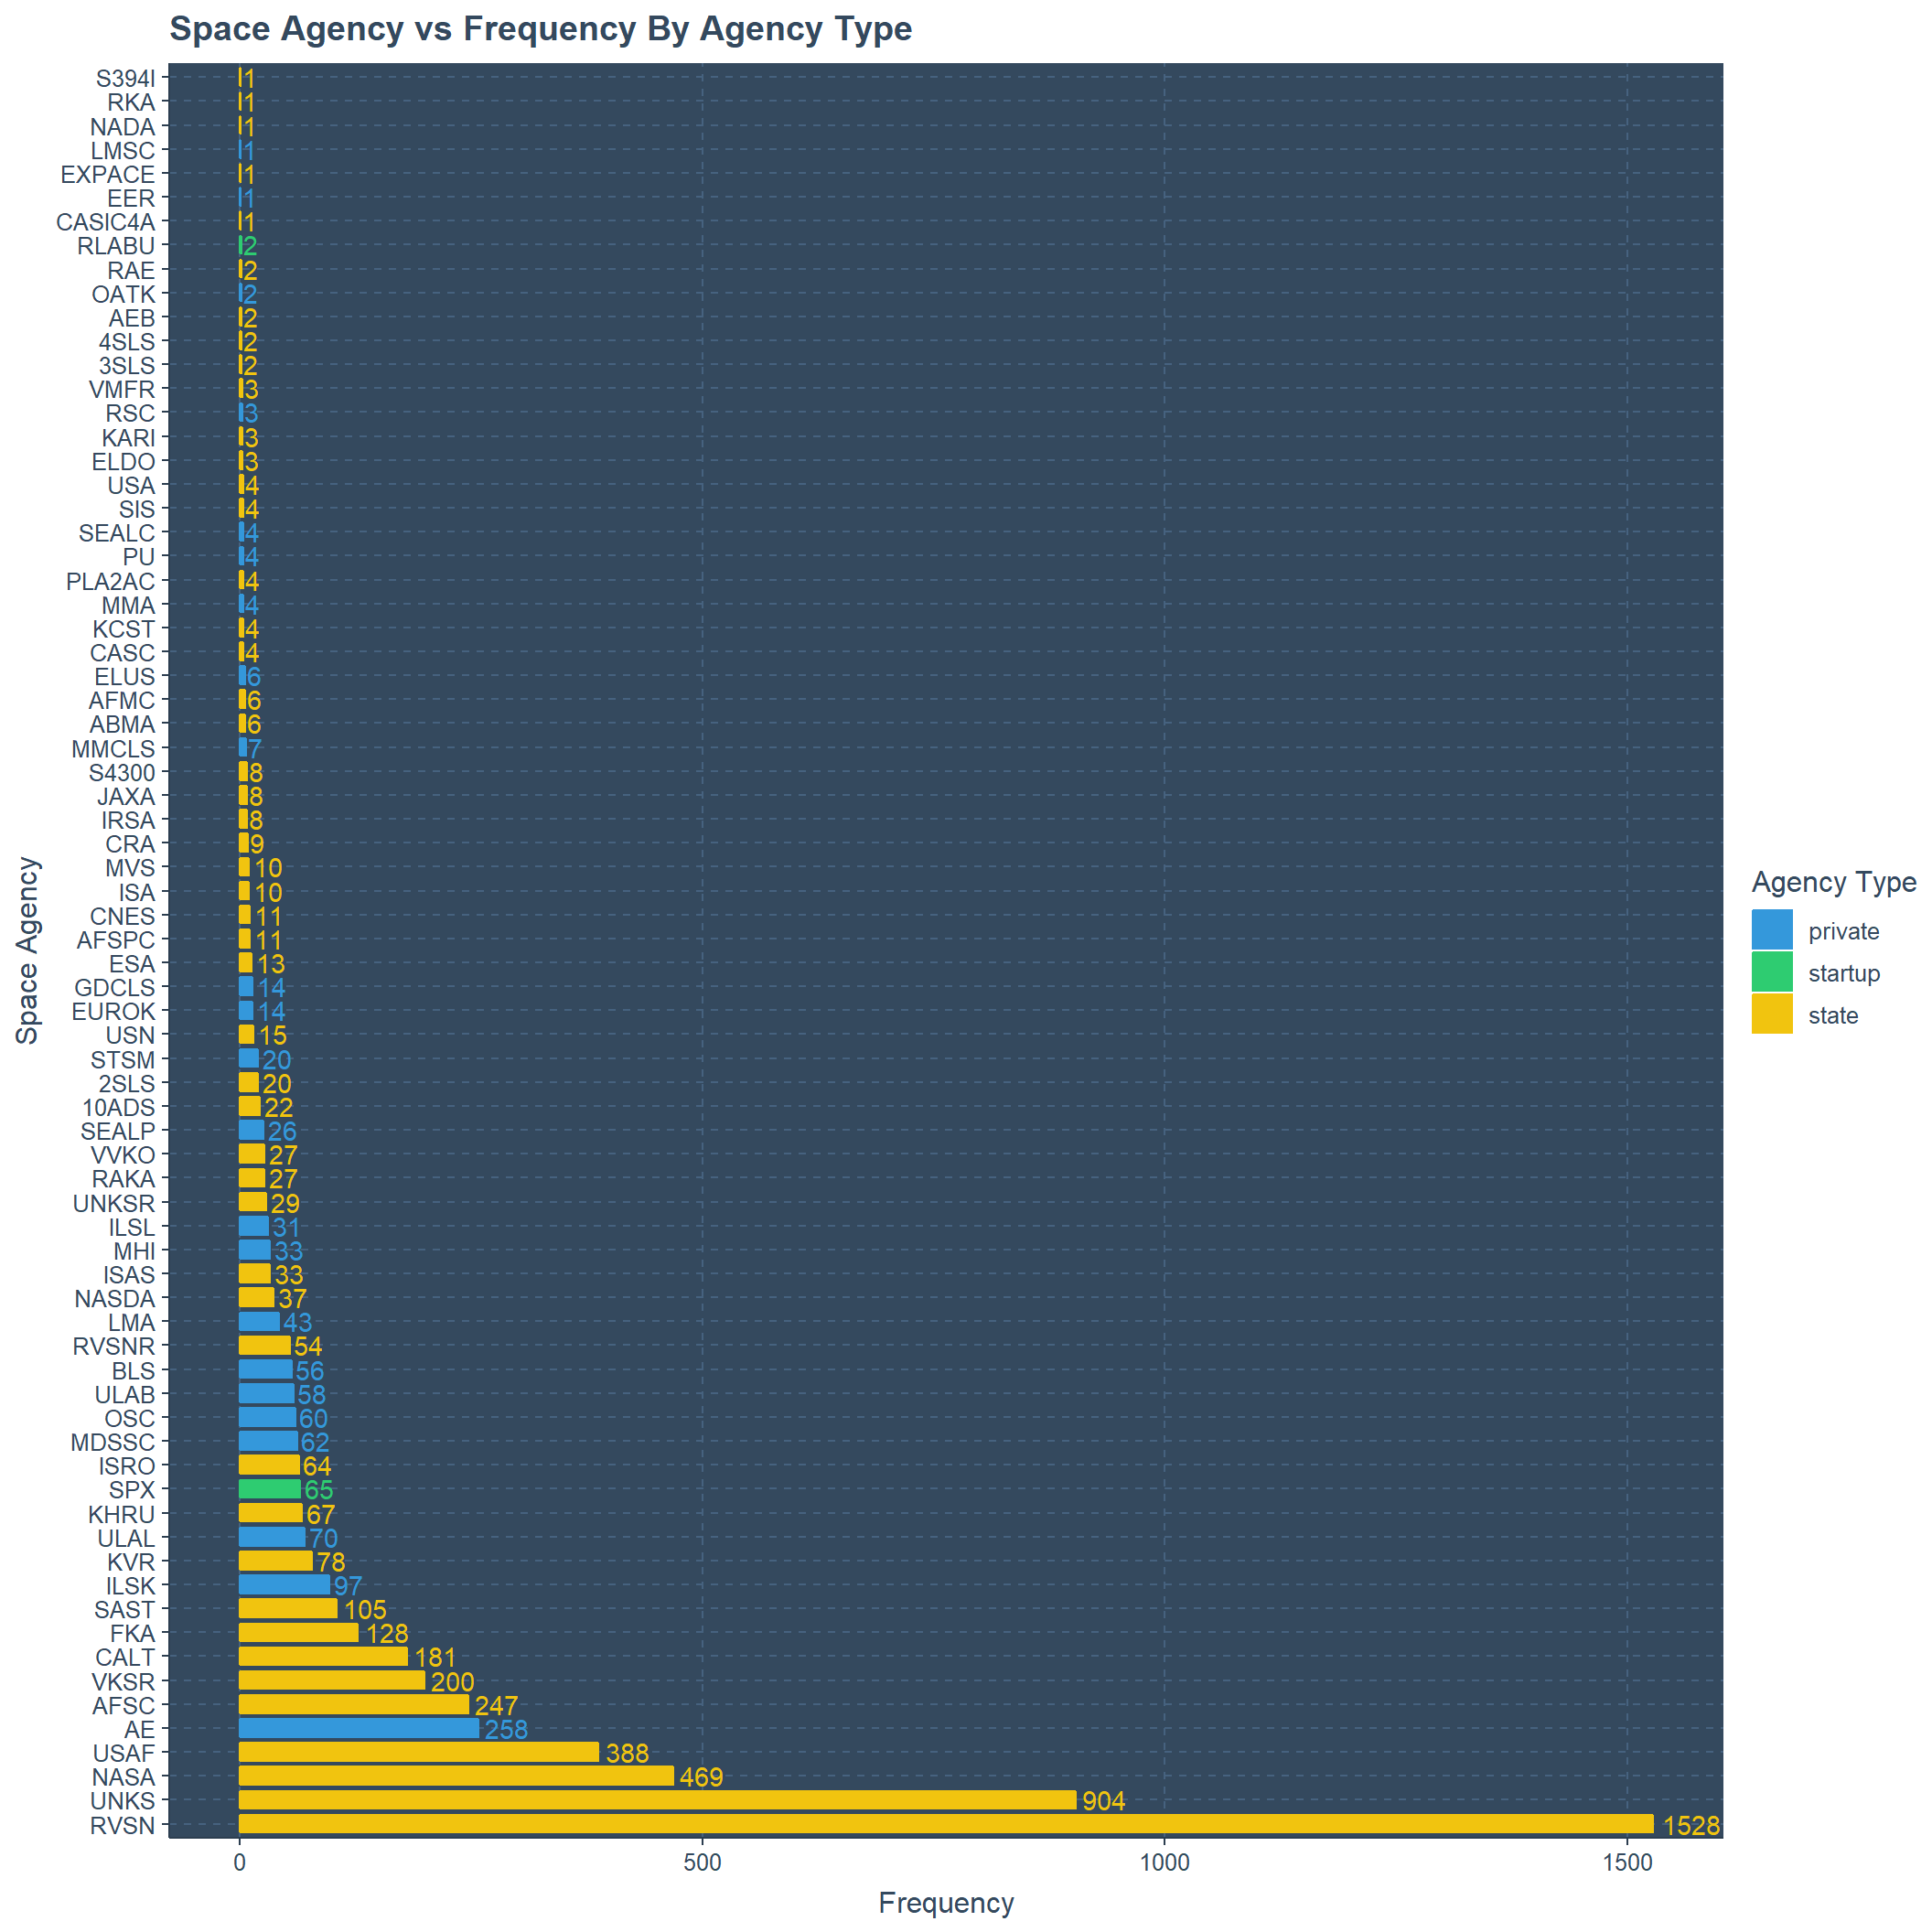
Type vs Count
Type of agencies is very complex because an agency can play multiple roles. Highest amount of count is for O/LA type with 3227 and second place is for LA type with 821 counts. There are 145 agencies with the highest combination of types and this category is O/LA/LV/PL/E/S with 145 counts.
agencies[,c('type','count')] %>% group_by(type) %>%
  summarise_each(funs(sum)) %>% arrange(count) %>%
ggplot(.,aes(fct_inorder(type),count))+
  geom_bar(stat = "identity")+
  geom_text(aes(label=count),hjust=-0.15)+coord_flip()+
  xlab("Type")+ylab("Frequency")+
  ggtitle("Type vs Frequency")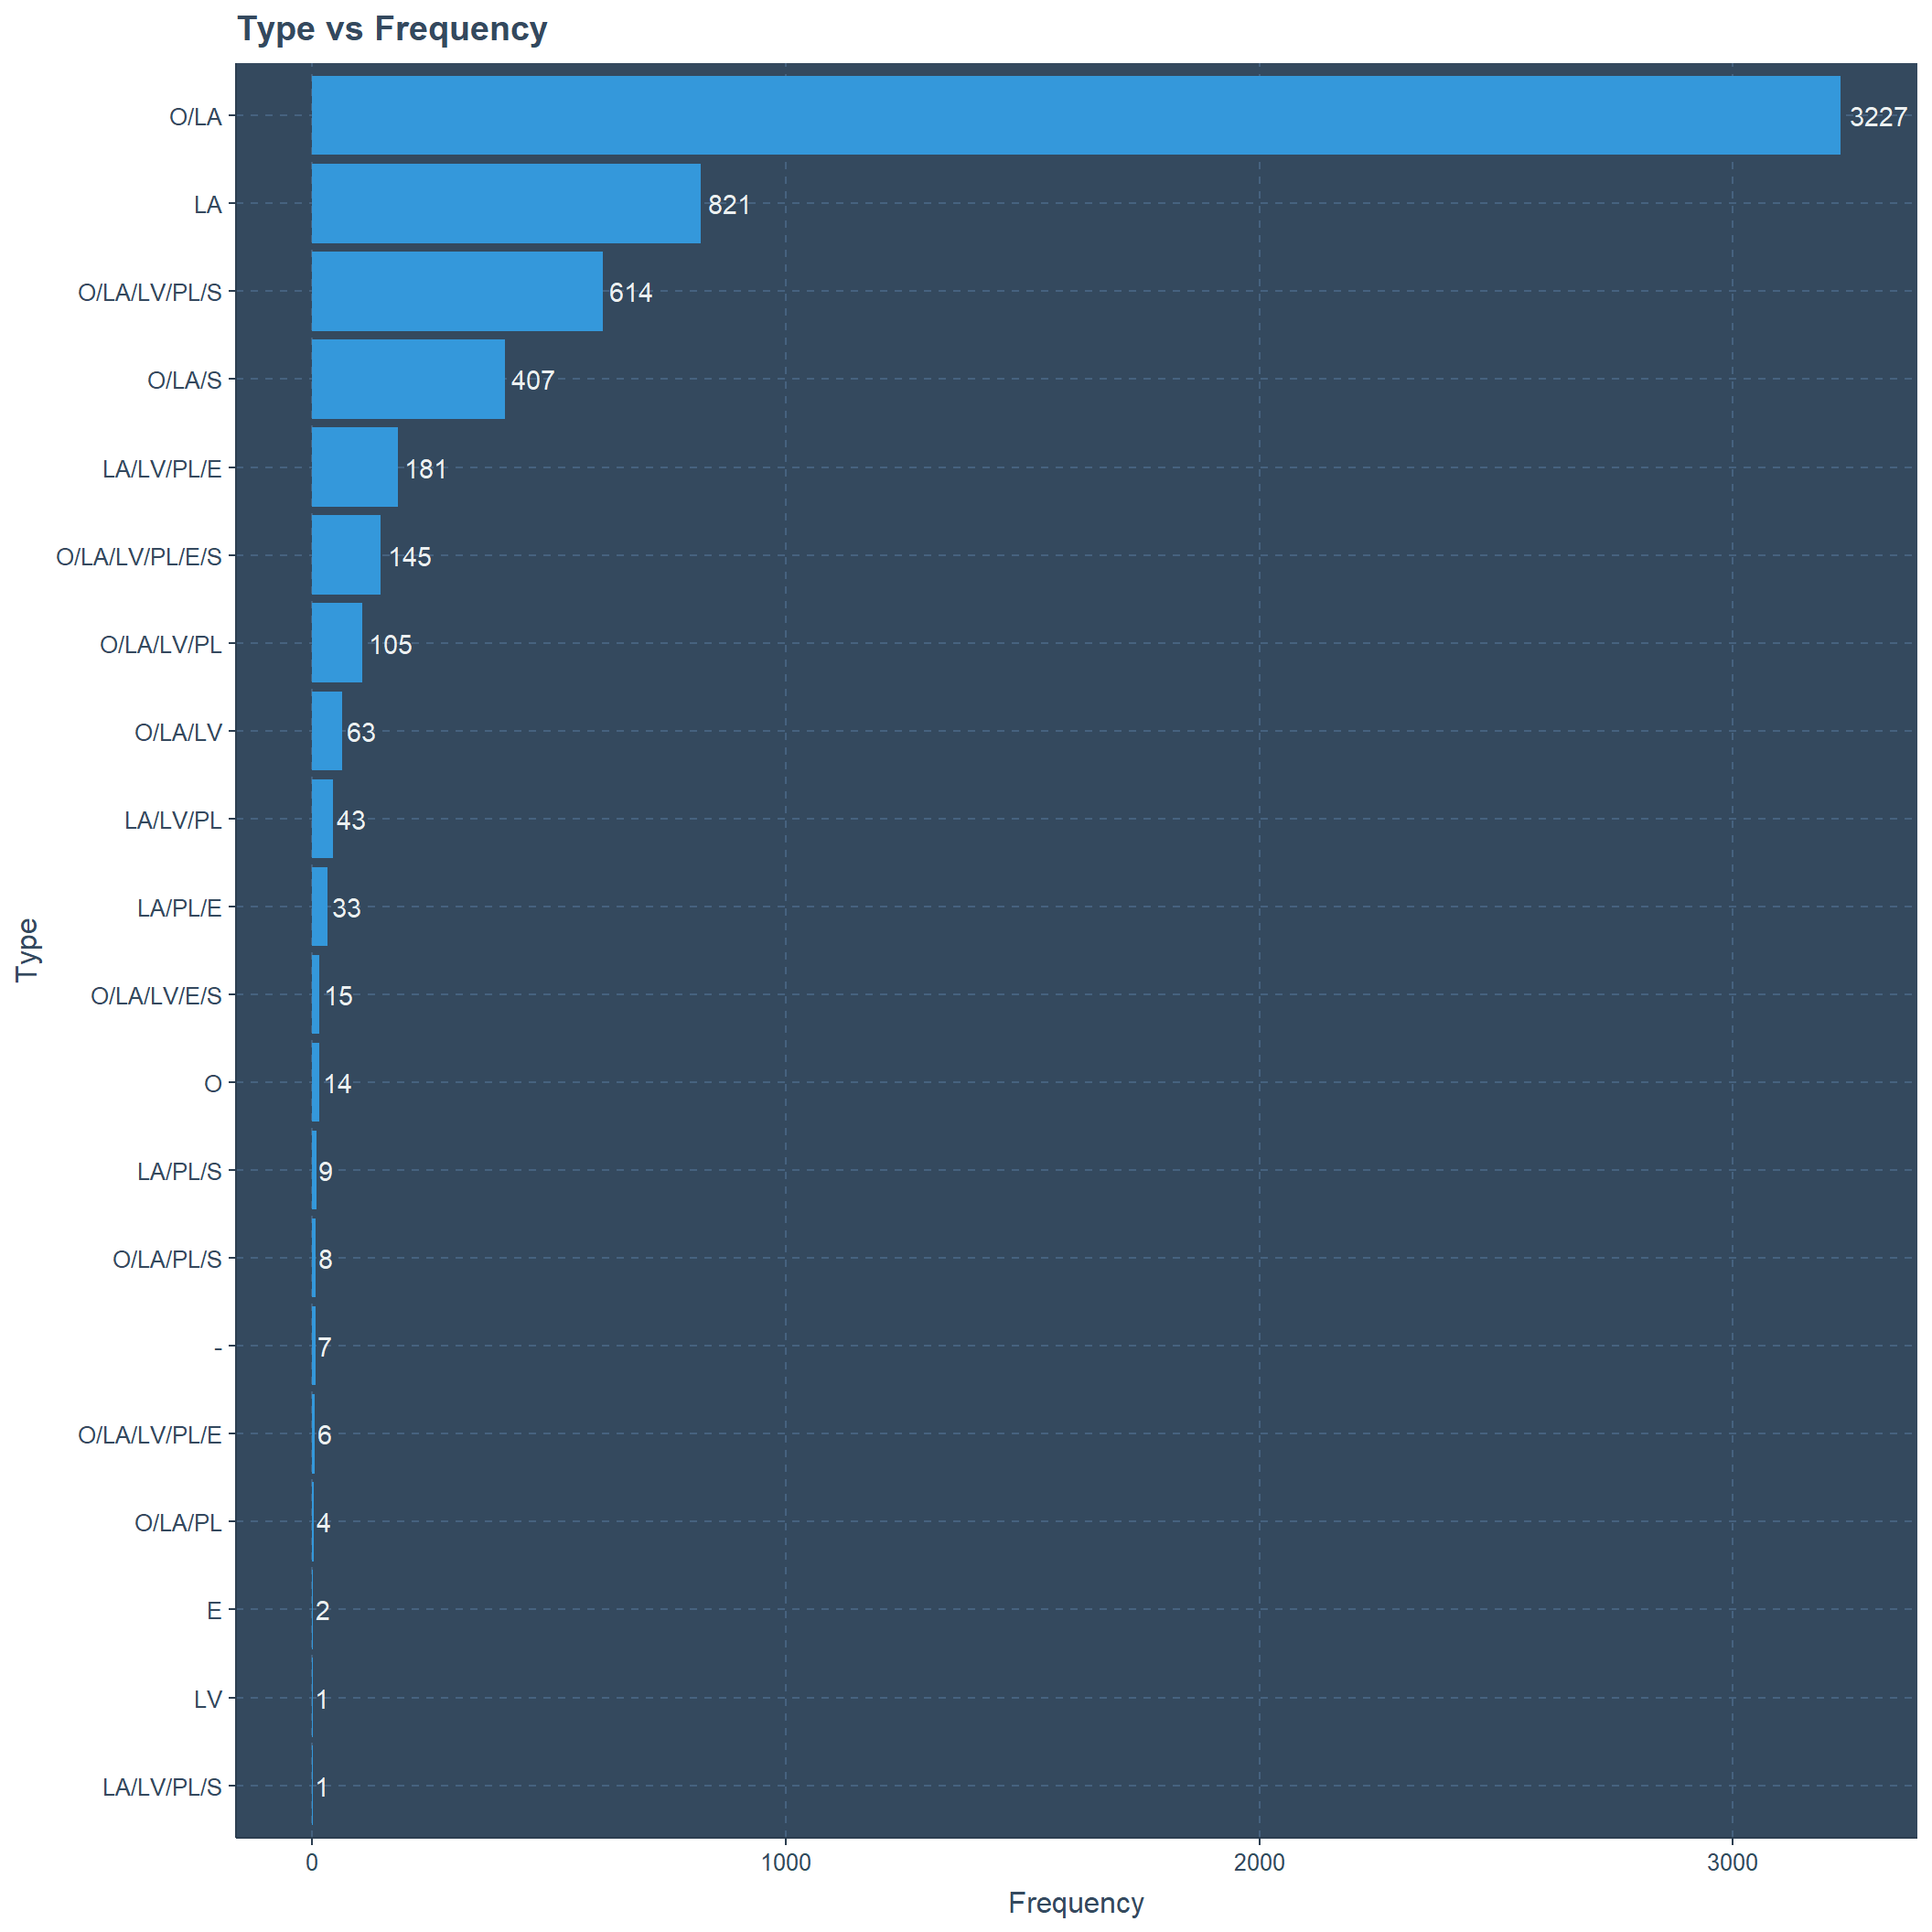
Class vs Count
Class C and B has similar amounts of count which is close to 1100 and most launches are from D class agencies with the count of 3584.
agencies[,c('class','count')] %>% group_by(class) %>%
  summarise_each(funs(sum)) %>% arrange(count) %>%
ggplot(.,aes(fct_inorder(class),count))+
  geom_bar(stat = "identity")+
  geom_text(aes(label=count),vjust=-0.15)+
  xlab("Class")+ylab("Frequency")+
  ggtitle("Class vs Frequency")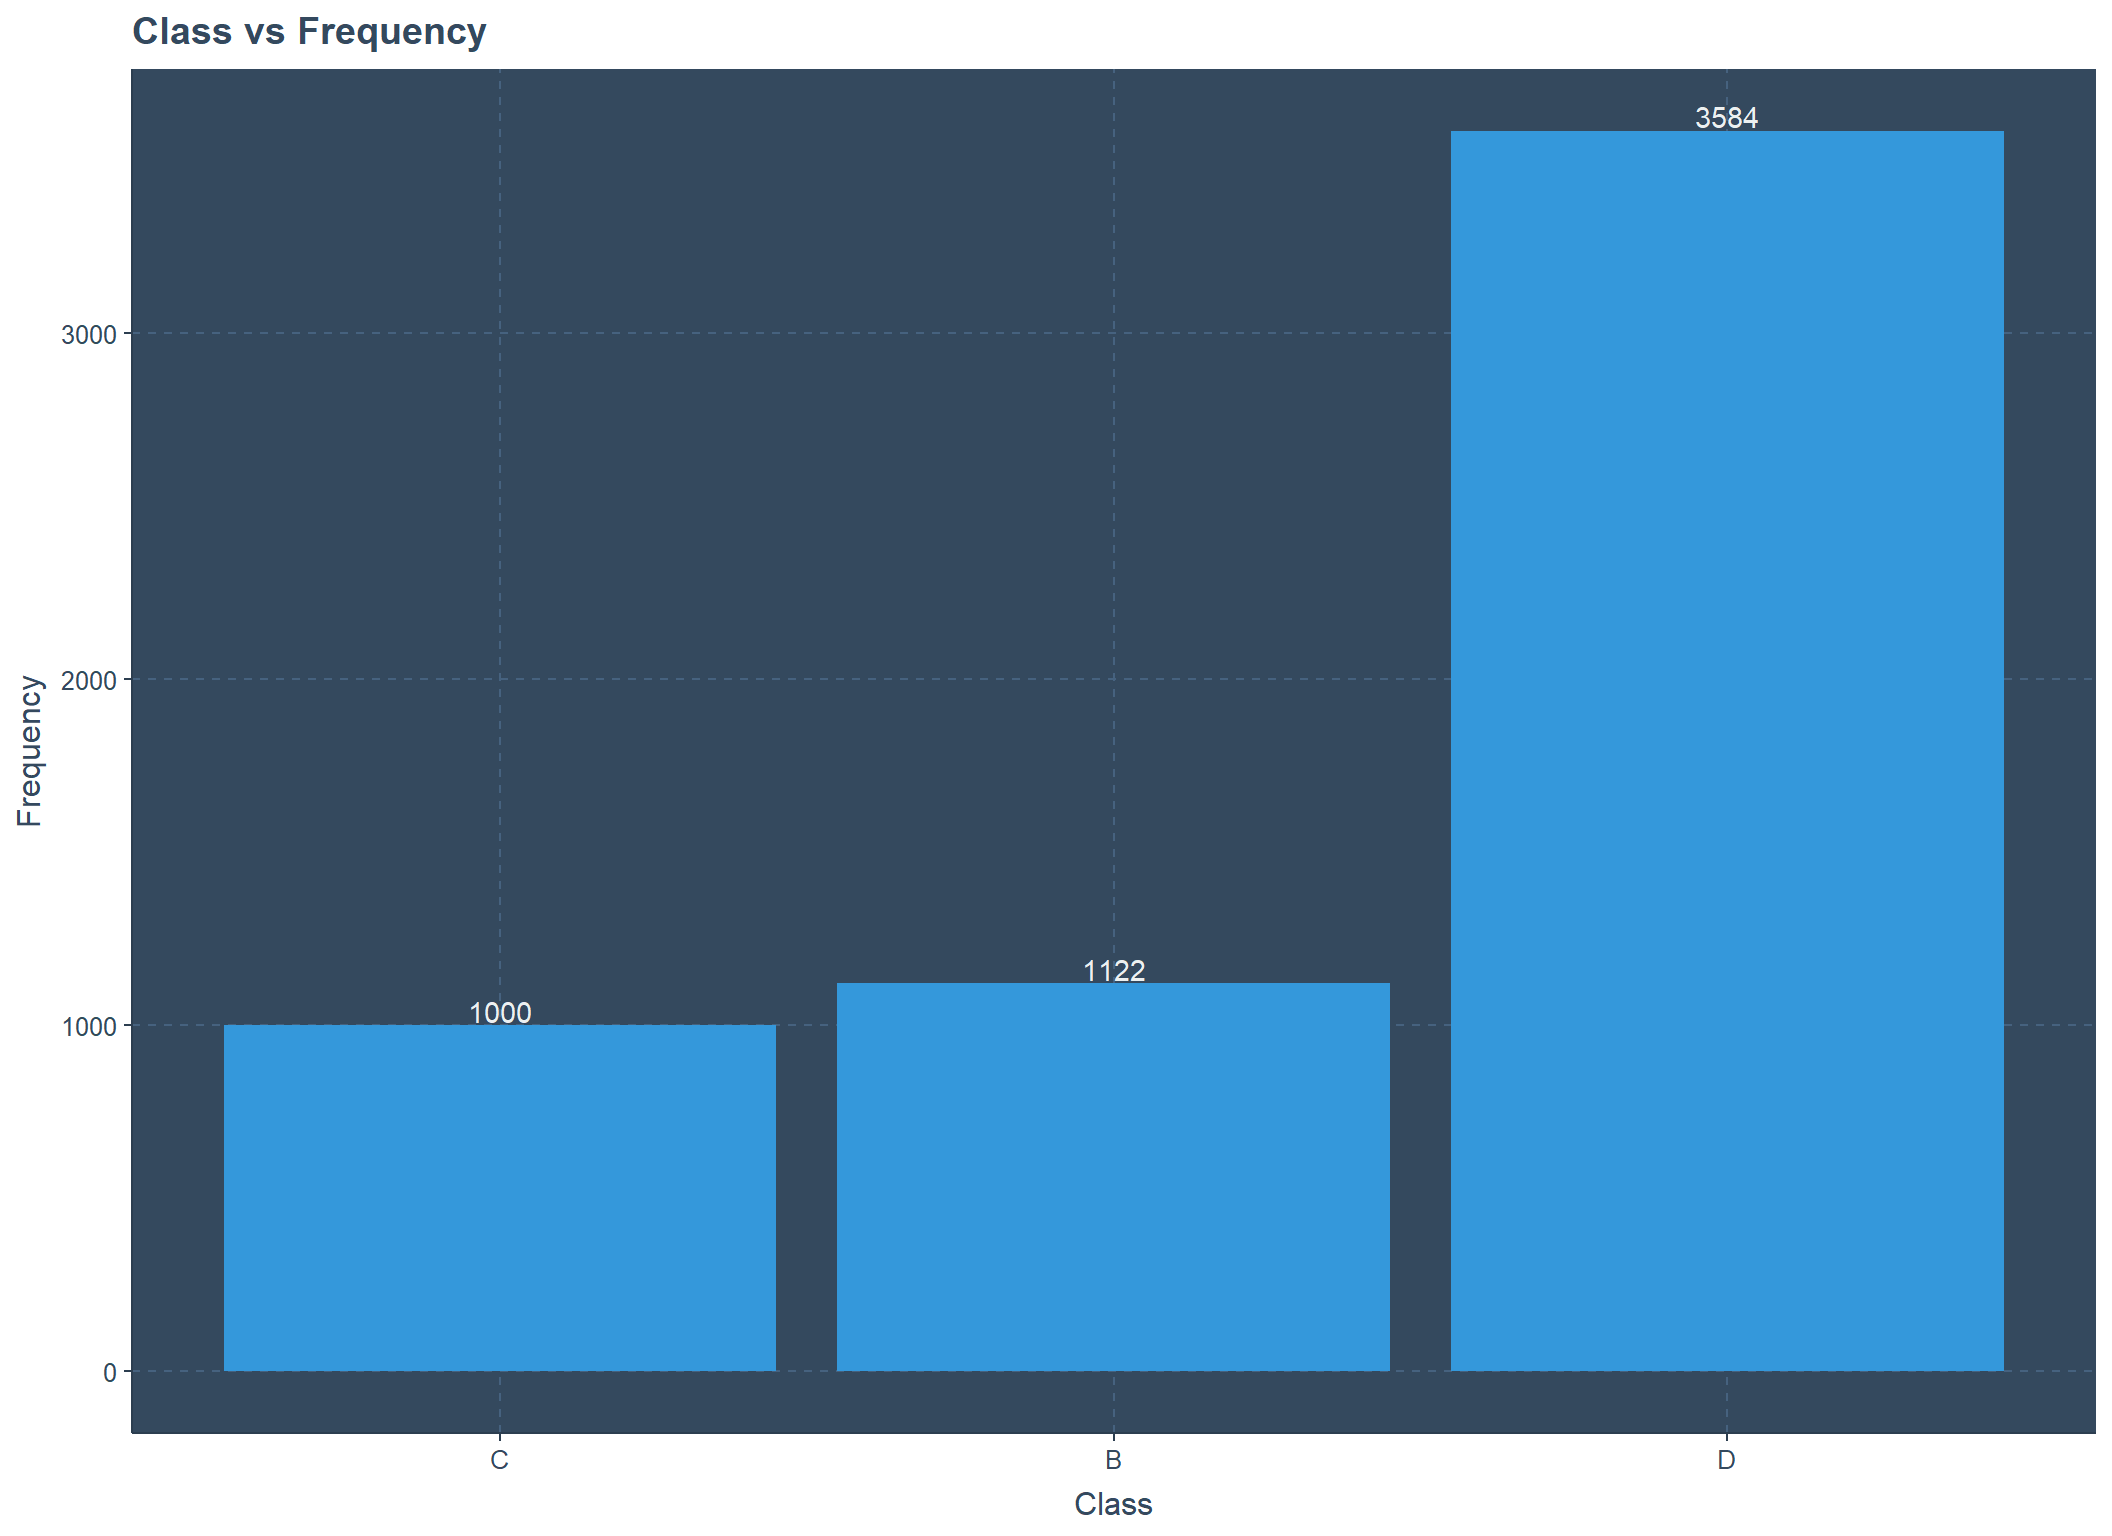
Agency Type vs Count
In perspective of agency type there are 4765 state owned launches, but only 67 launches from start-ups.
agencies[,c('agency_type','count')] %>% group_by(agency_type) %>%
  summarise_each(funs(sum)) %>% arrange(count) %>%
ggplot(.,aes(fct_inorder(agency_type),count))+
  geom_bar(stat = "identity")+
  geom_text(aes(label=count),vjust=-0.15)+
  xlab("Agency Type")+ylab("Frequency")+
ggtitle("Agency Type vs Frequency") 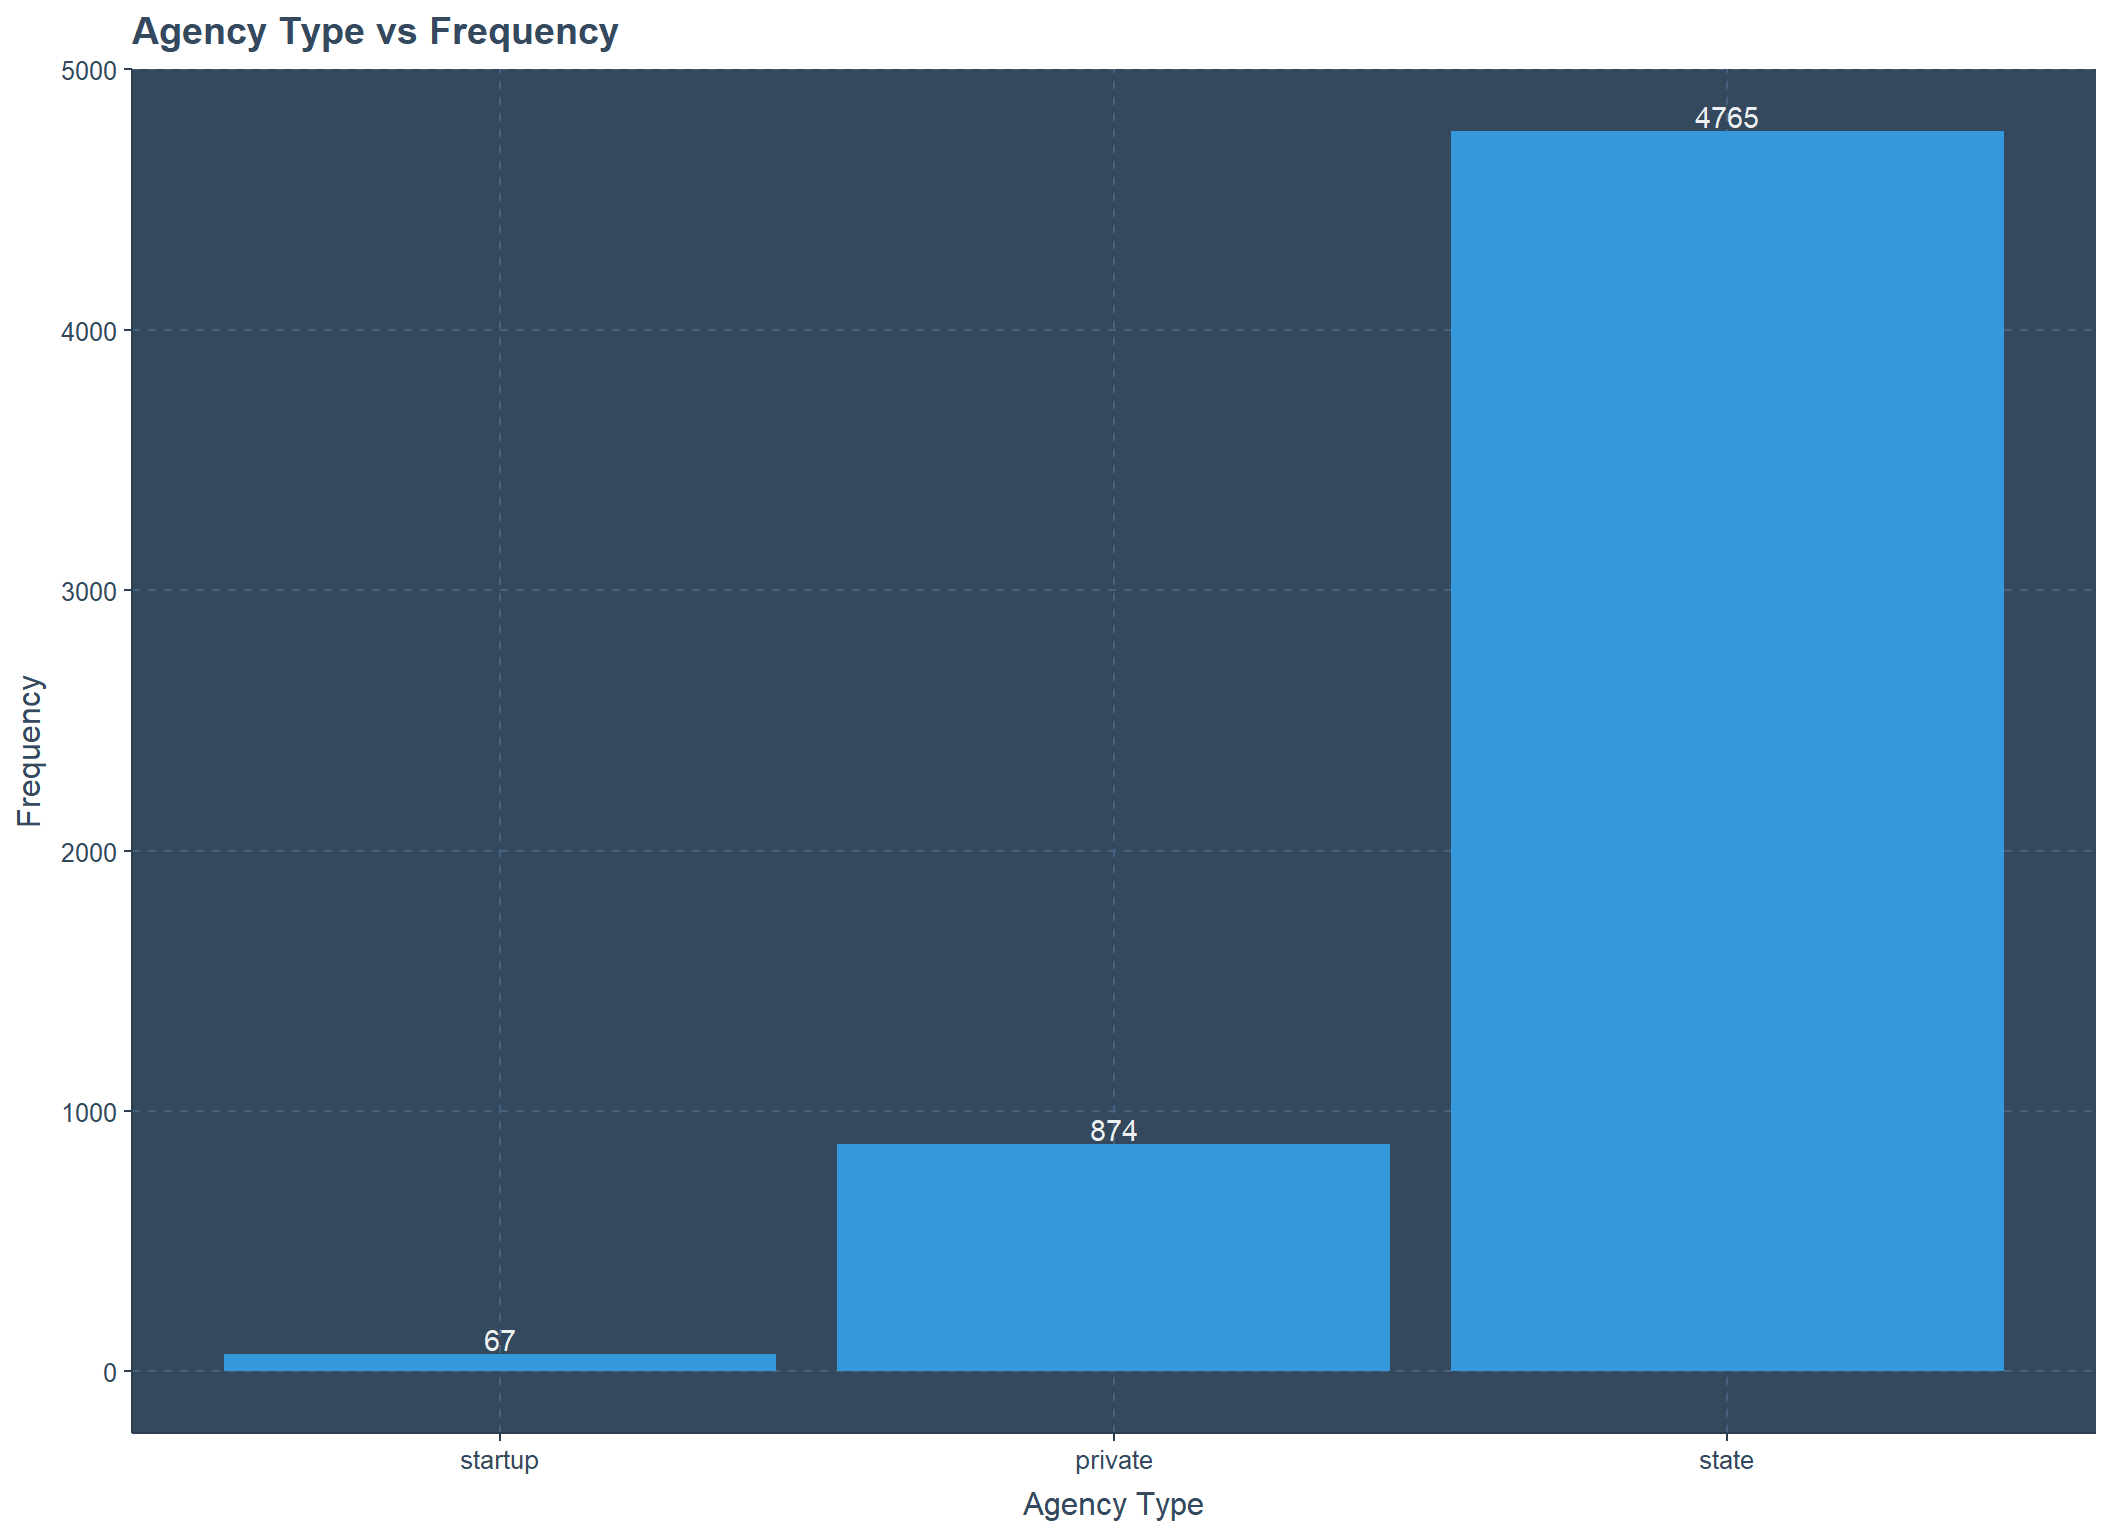
State Code vs Count
Close to 2500 missions were launched by Soviet Union and 1709 were done by Unite States.
agencies[,c('state_code','count')] %>% group_by(state_code) %>%
  summarise_each(funs(sum)) %>% arrange(count) %>%
ggplot(.,aes(fct_inorder(state_code),count))+
  geom_bar(stat = "identity")+ coord_flip()+
  geom_text(aes(label=count),hjust=-0.15)+
  xlab("State Code")+ylab("Frequency")+
  ggtitle("State Code vs Count")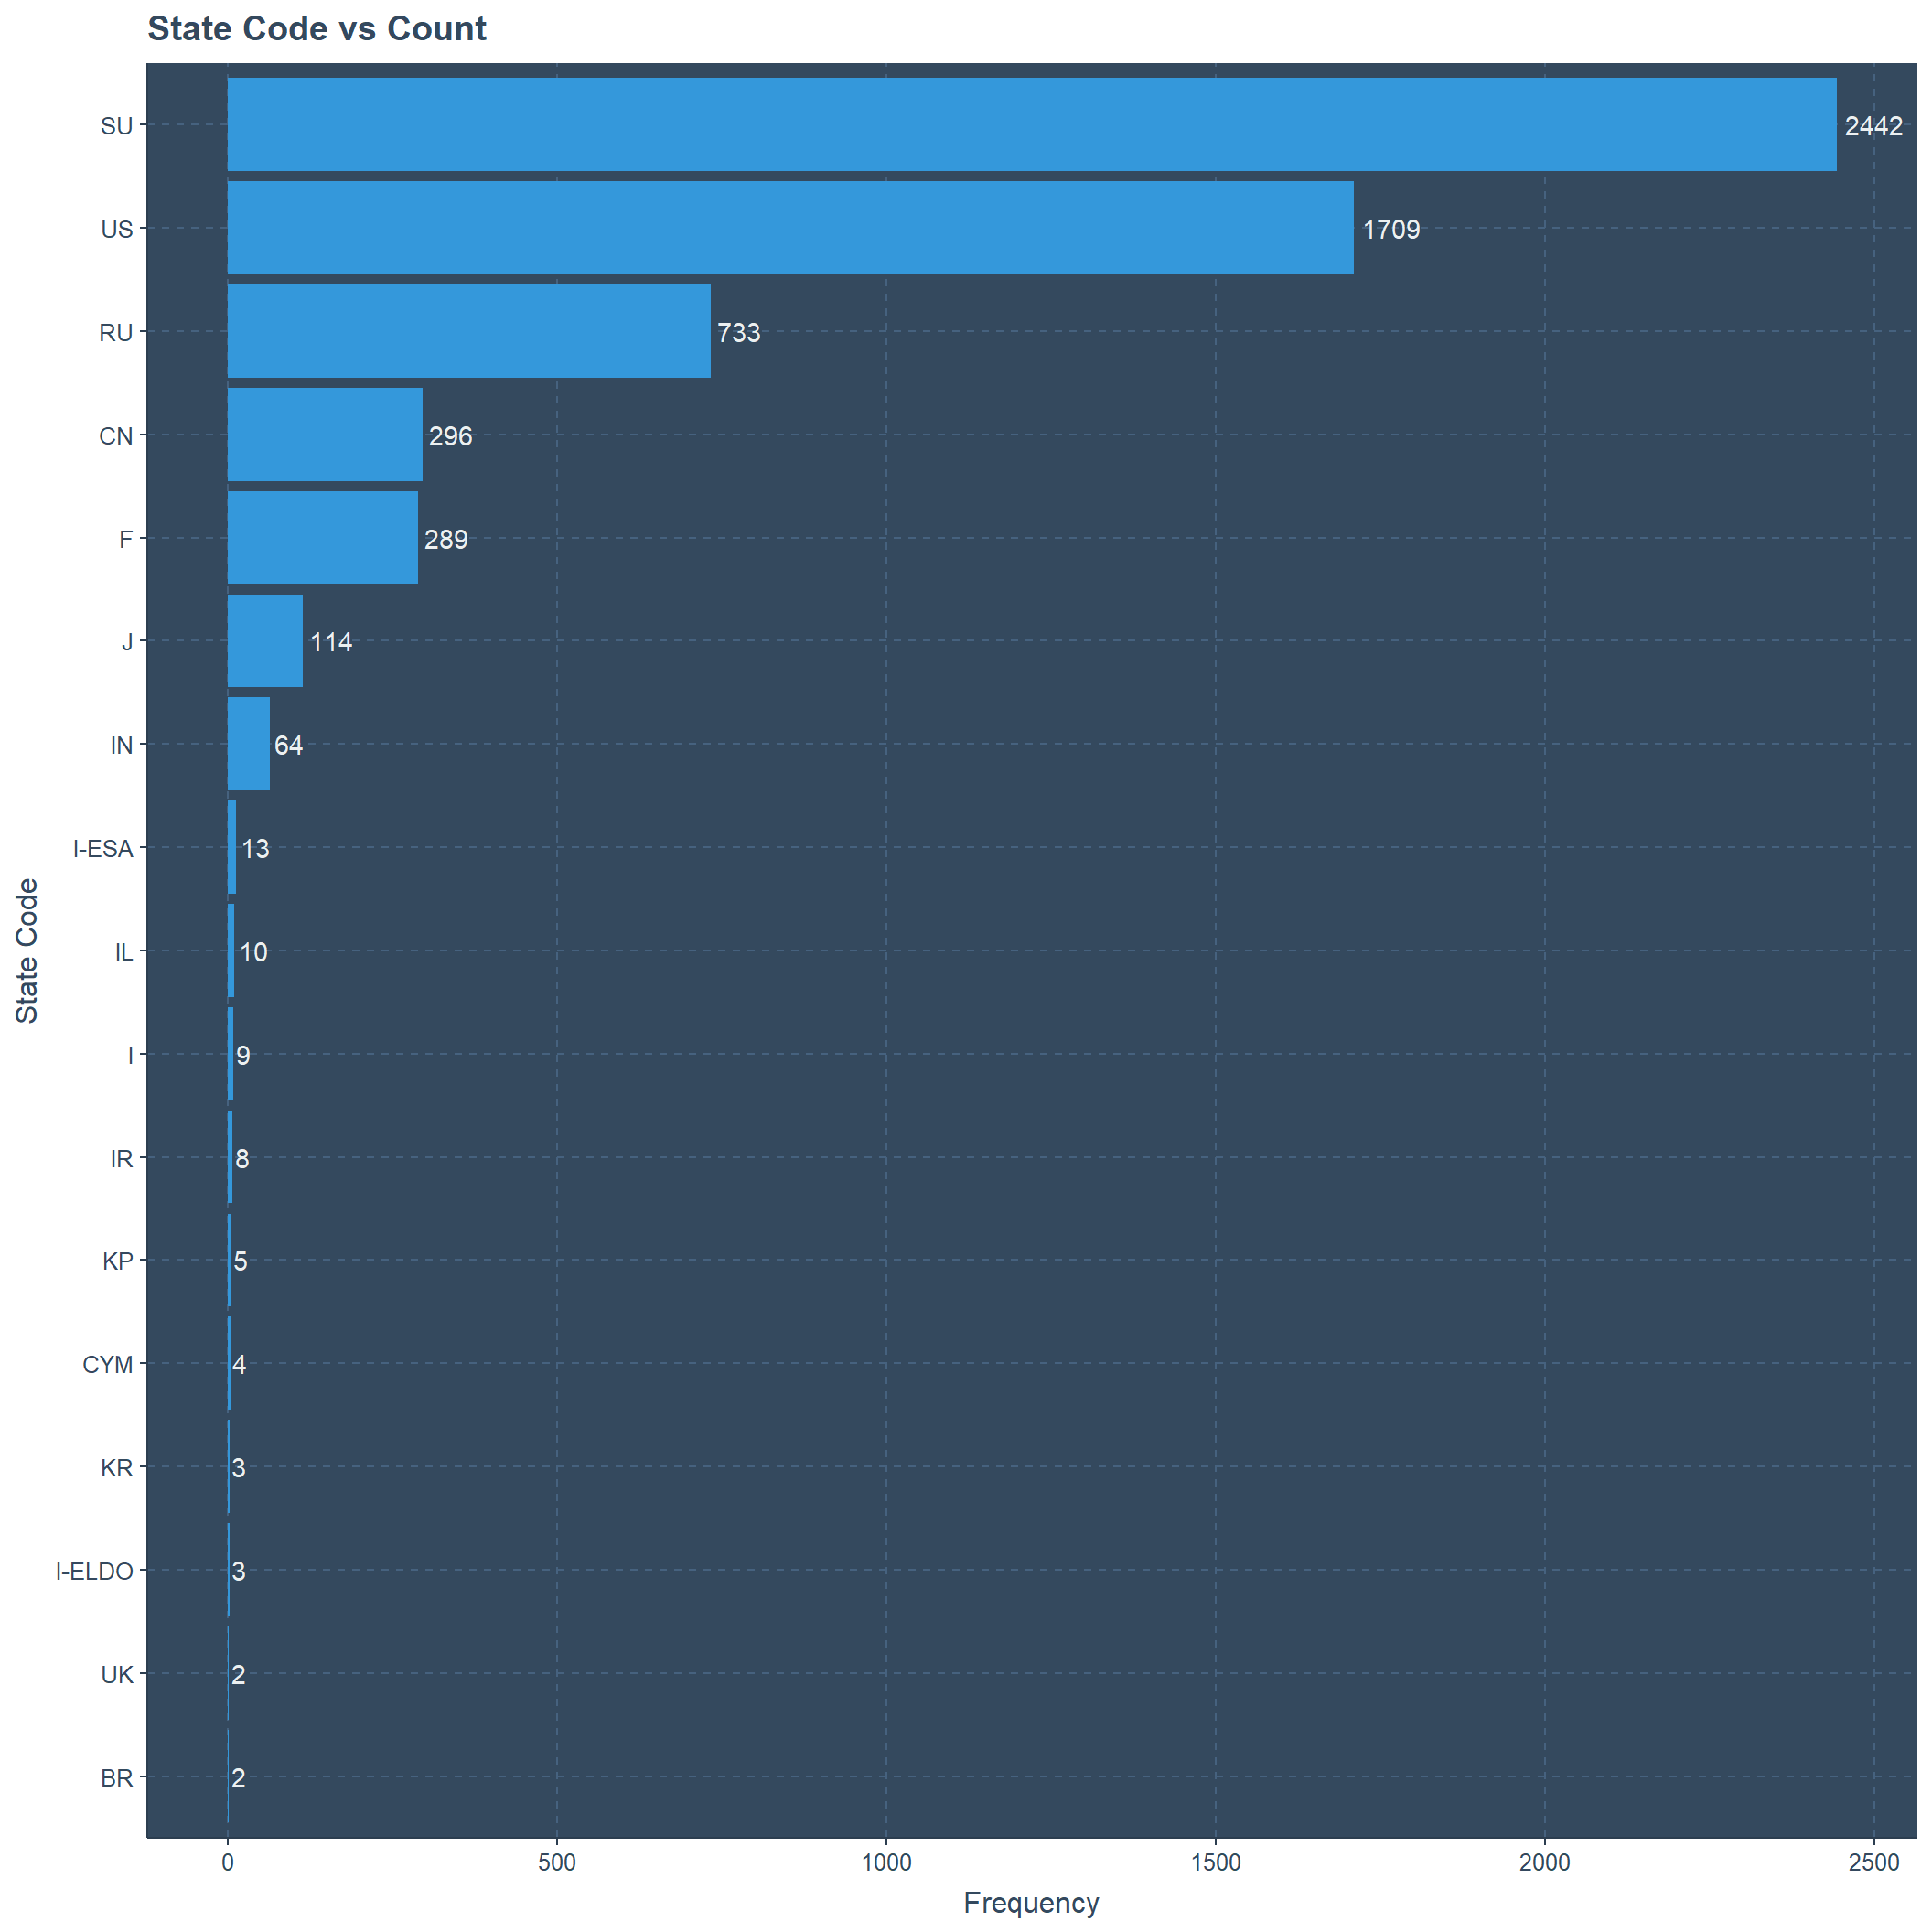
Location vs Count
More than 1500 launches are from Mosvka? and exactly 1204 launches from Moskva. Further, 469 launches from Washington D.C.
agencies[,c('location','count')] %>% group_by(location) %>%
  summarise_each(funs(sum)) %>% arrange(count) %>%
ggplot(.,aes(fct_inorder(location),count))+
  geom_bar(stat = "identity")+ coord_flip()+
  geom_text(aes(label=count),hjust=-0.15)+
  xlab("Location")+ylab("Frequency")+
  ggtitle("Location vs Count")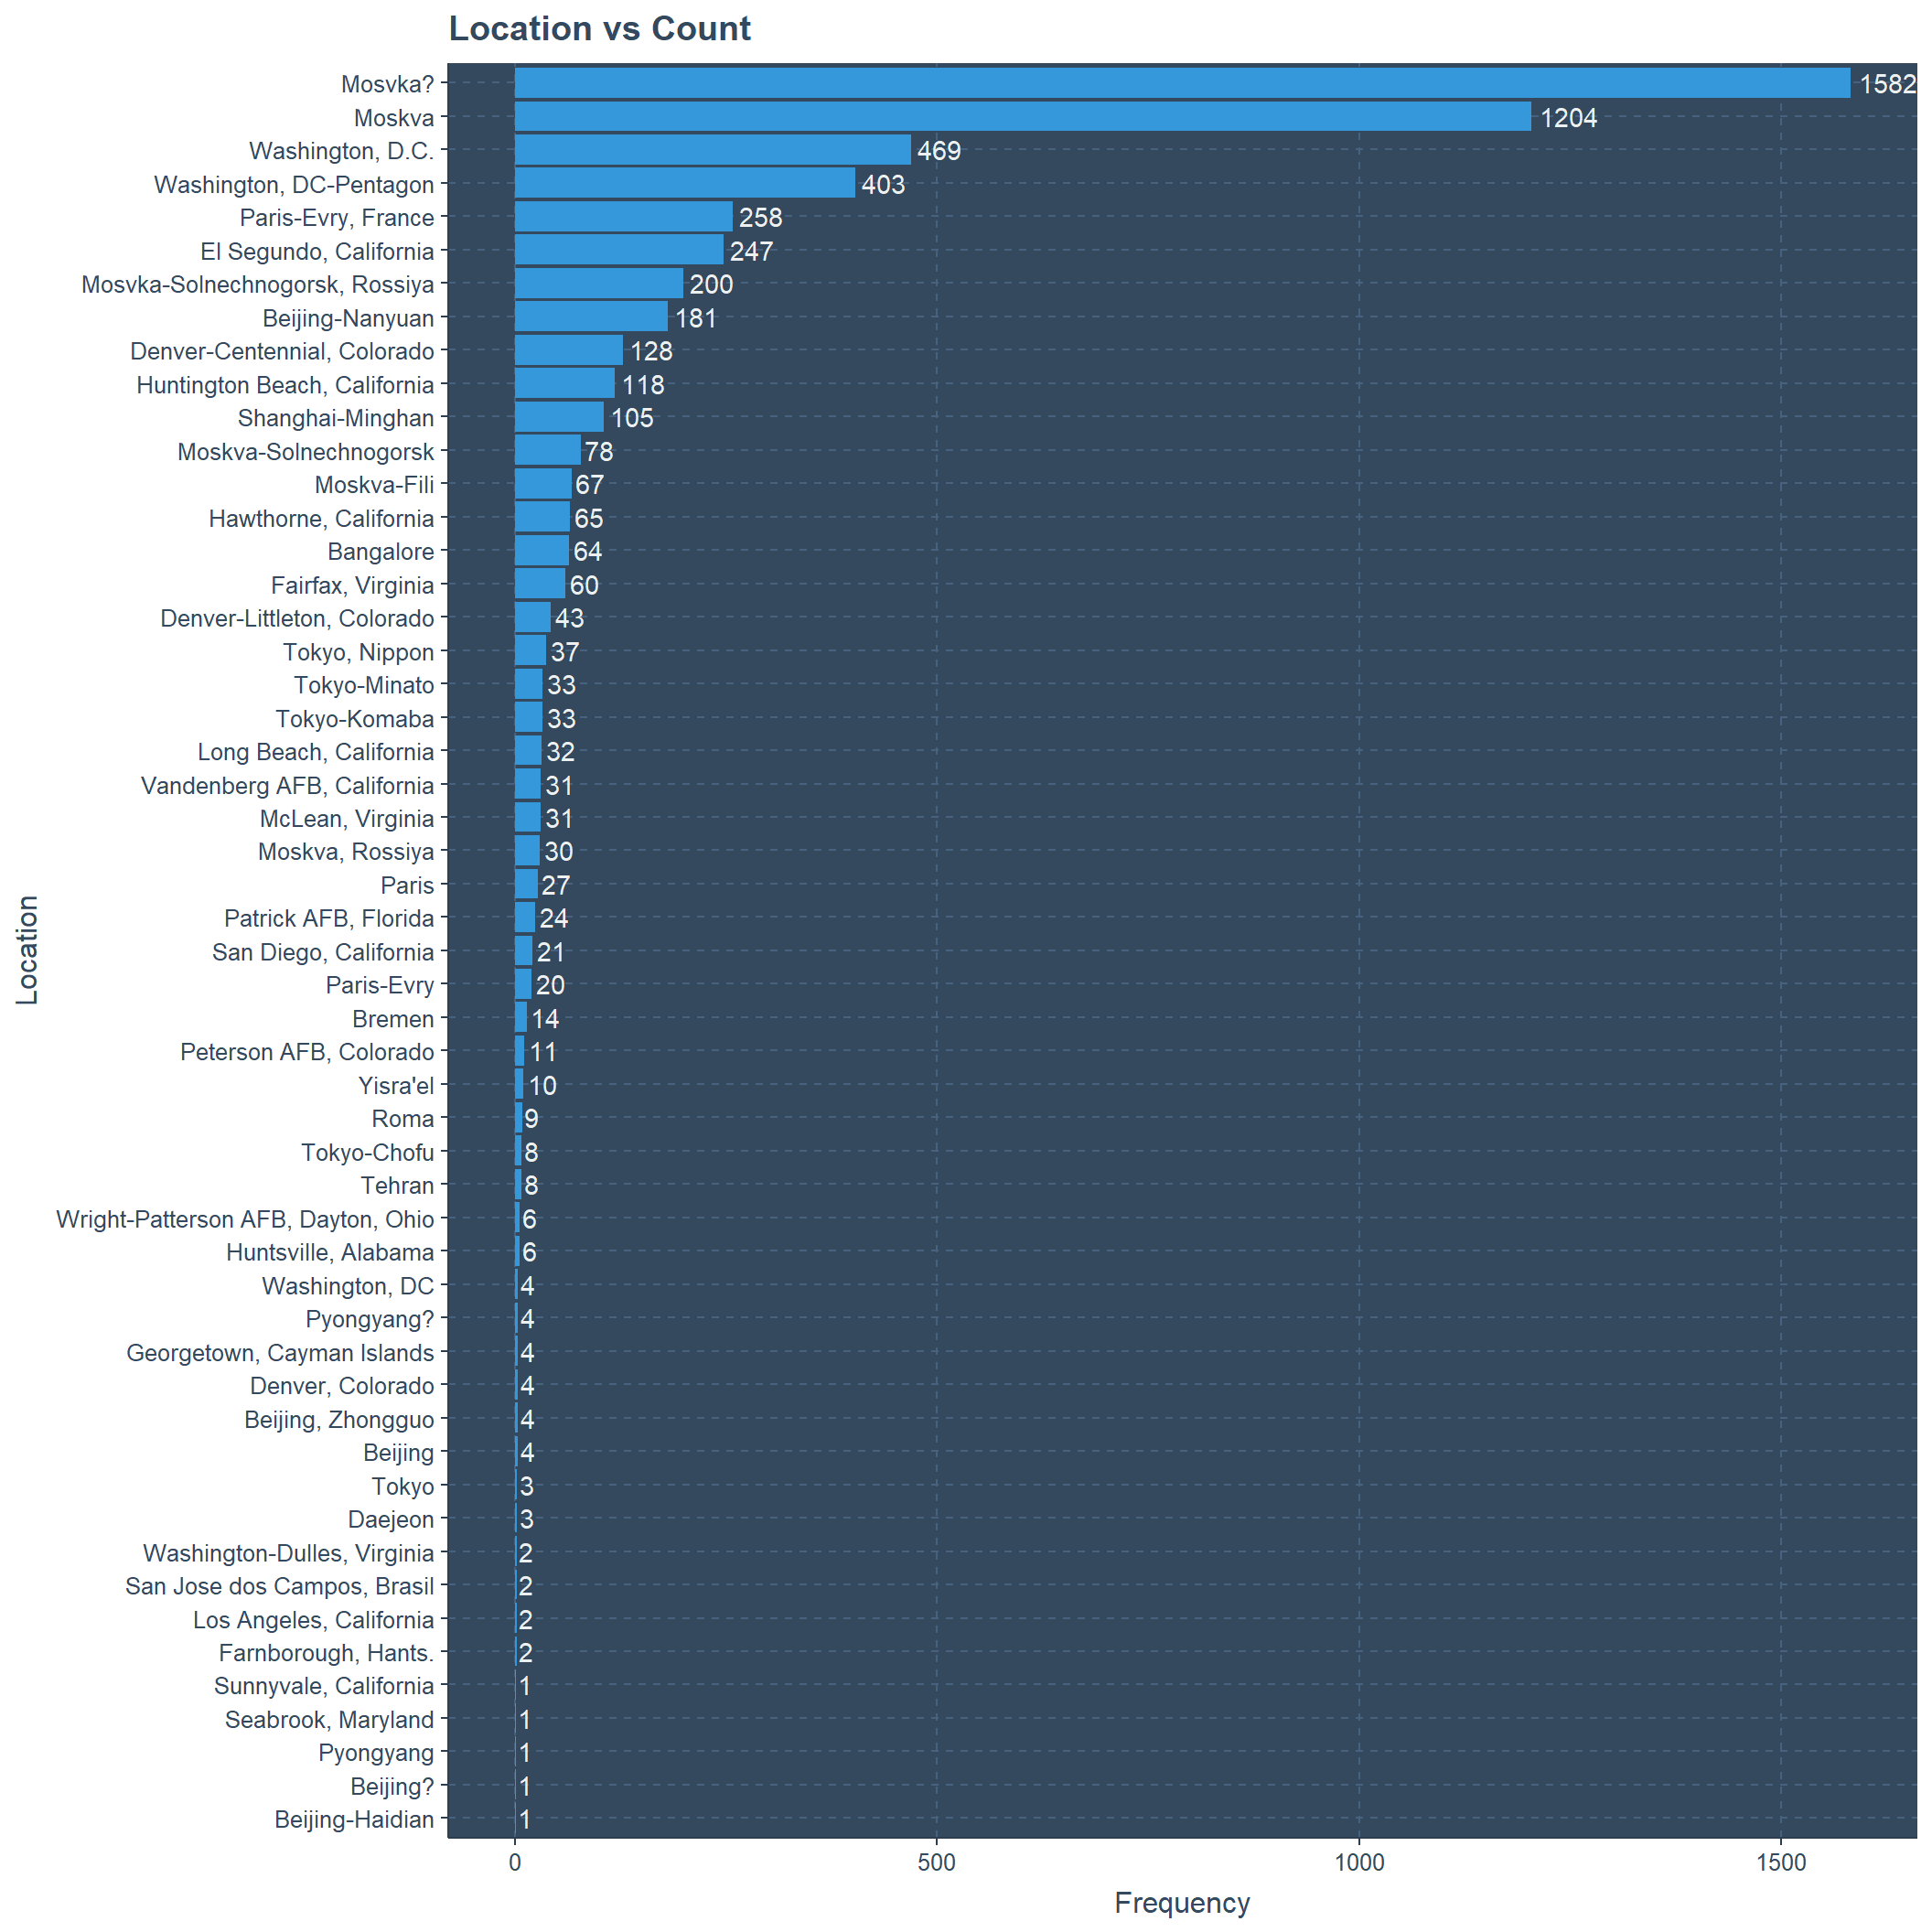
Start Year and End Year vs agency
Below is a Dumbbell plot to see at the agencies which are no longer active. Before 1960 there was very small activity and they are all owned by the state. With the American and Russian Space race we have private sector also being part of this adventure, but most of them are ending their service around the first half of 1990. There is more activity after this regularly but they are short lived for these agencies. Royal Aircraft Establishment (RAE) has long life for space adventure which was begun around late 1915, and ends its service in around 1990.
subset(agencies, substr(tstart,1,4) != "-" &
                 substr(tstop,1,4) != "-" &
                 substr(tstop,1,4) != "*" ) %>%
ggplot(aes(y=reorder(agency,as.numeric(substr(tstart,1,4))),
           x=as.numeric(substr(tstart,1,4)),xend=as.numeric(substr(tstop,1,4)),
           fill=agency_type,color=agency_type))+
  geom_dumbbell(size_x = 2,size_xend = 2.75,size=1.25)+
  xlab("Year")+ylab("Agency")+
  scale_x_continuous(breaks=seq(1910,2020,5),labels=seq(1910,2020,5))+
  labs(fill="Agency Type",color="Agency Type")+
  theme(axis.text.x = element_text(angle = 90))+
  ggtitle("Start Year and End Year vs Agency If We Know When")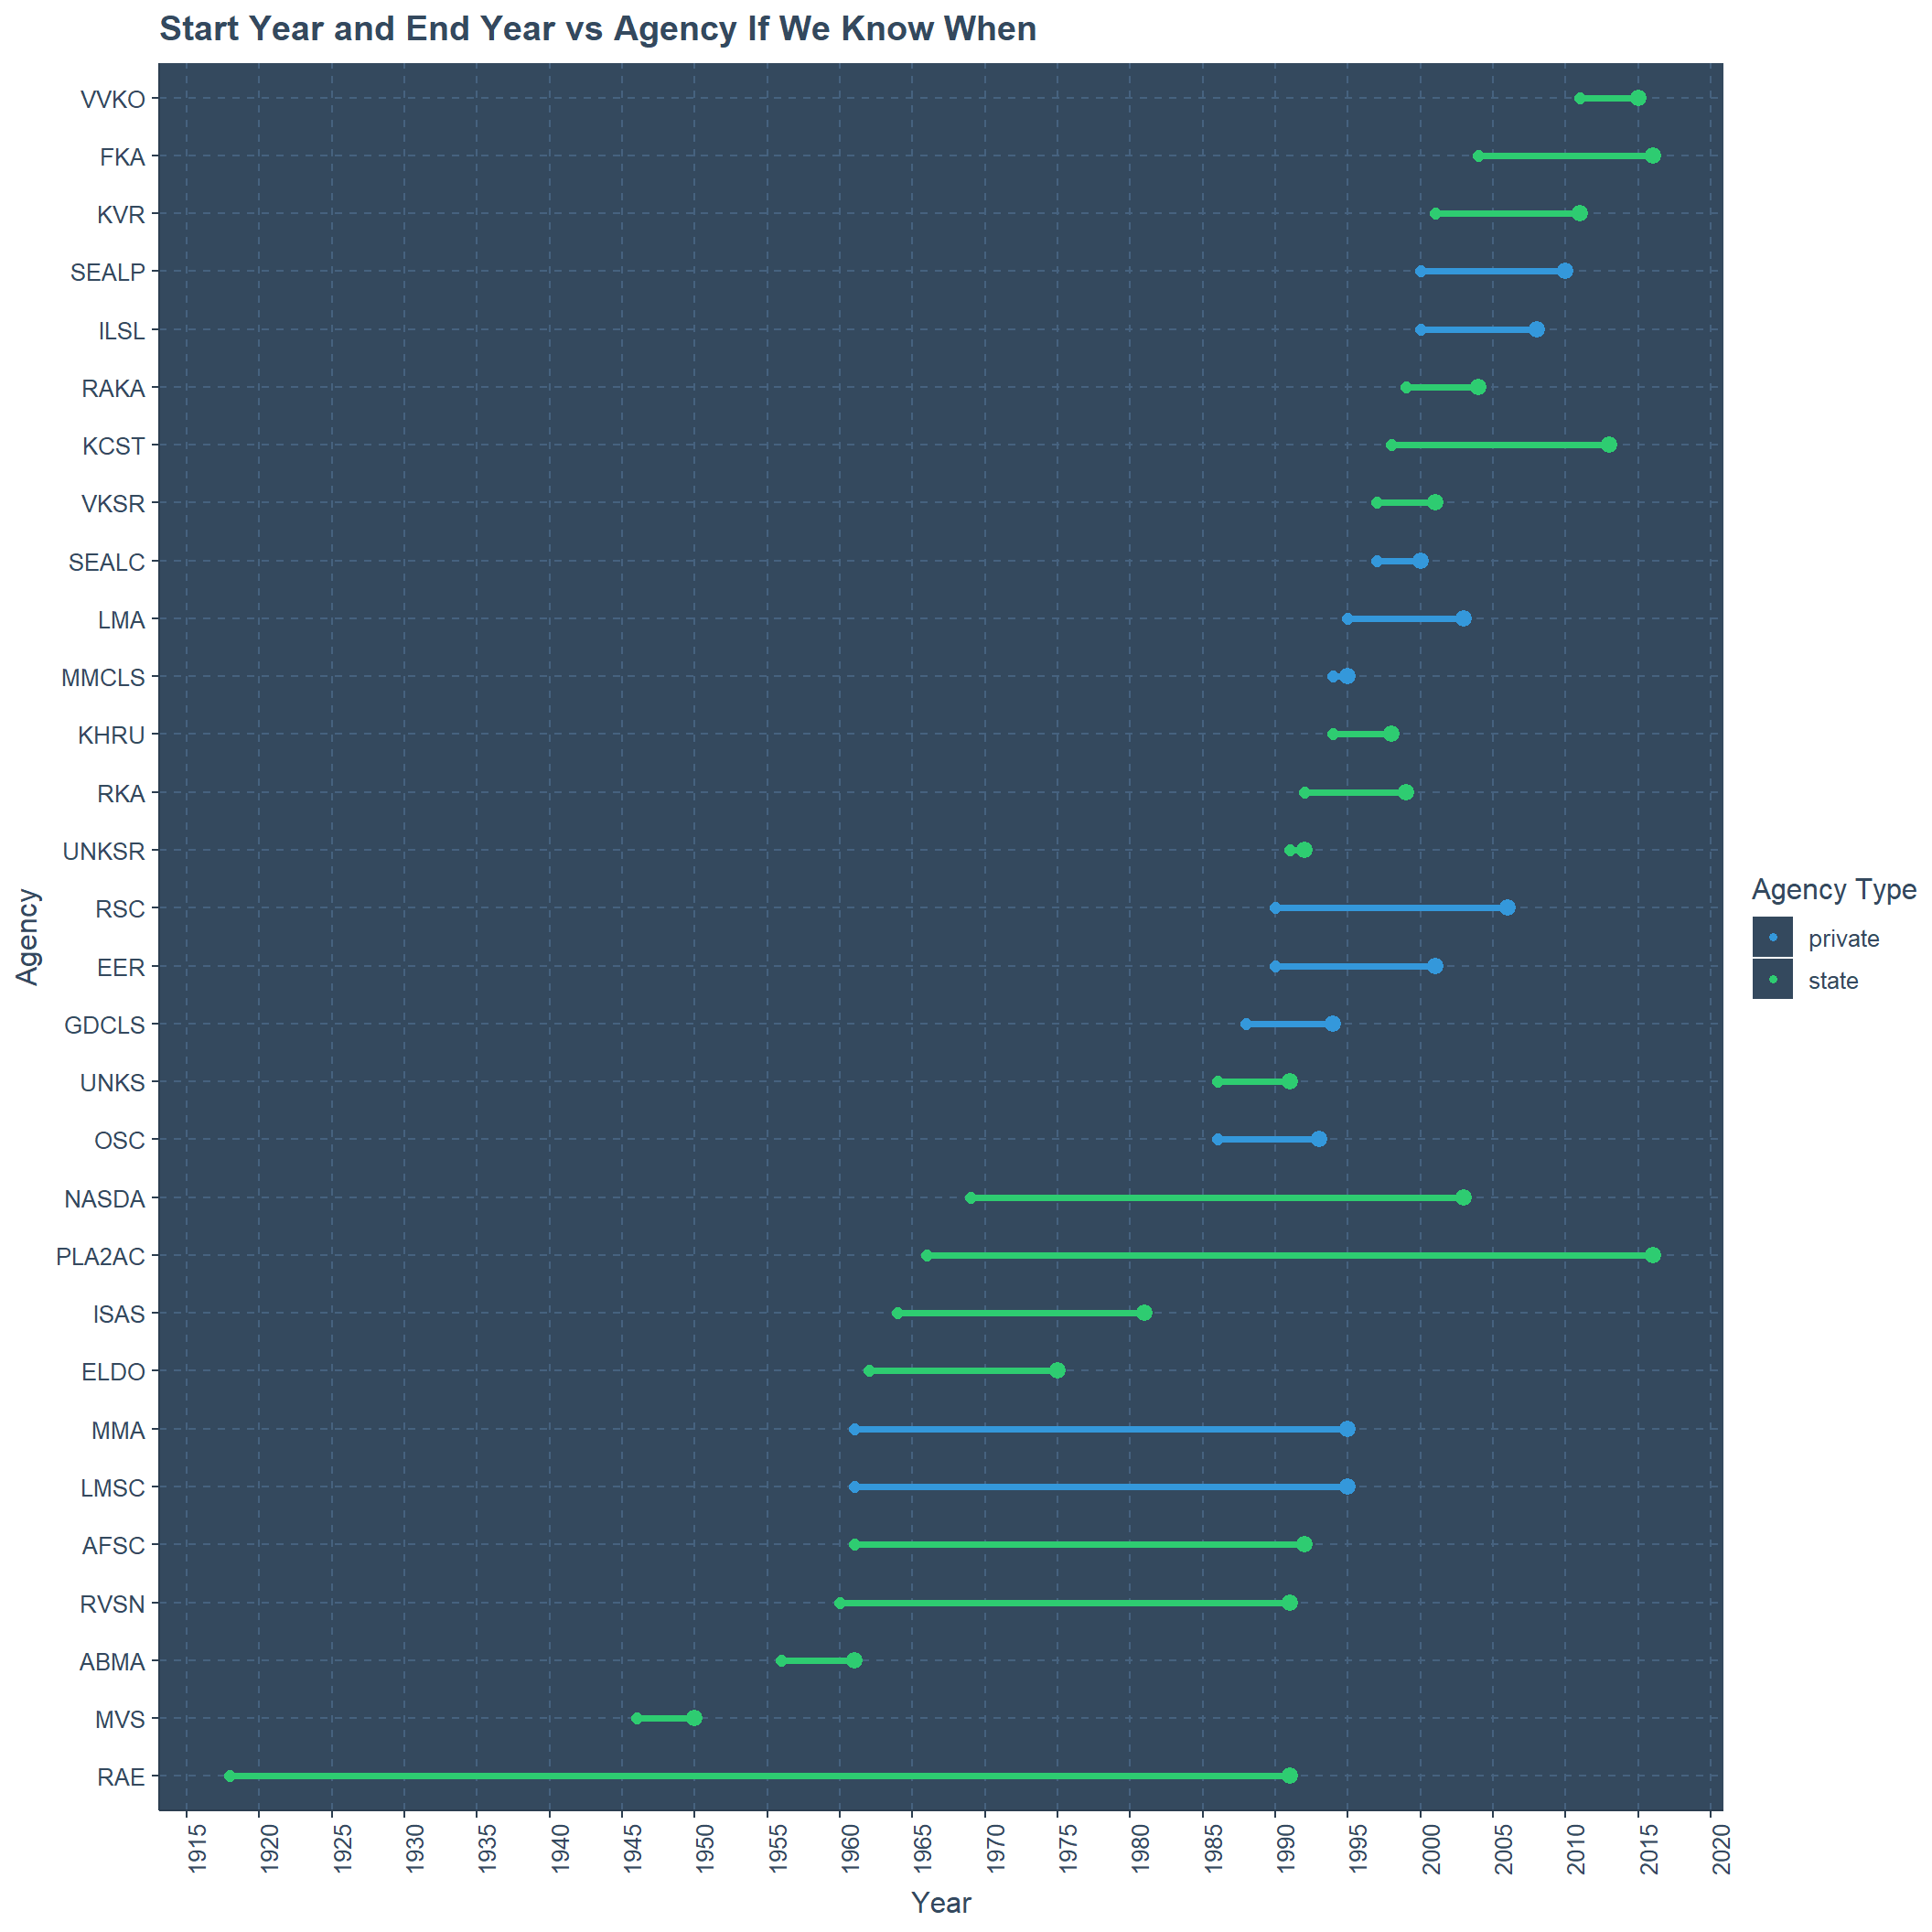
It should be effectively noted that “-” means still active and “*" means unknown in my perspective. Here we cannot consider the years as numeric because of the characters used. Agencies like NASA and Space X are still active according to my knowledge therefore I considered the above assumption for characters. Most of these agencies are state owned and after Space X there is Rocket Lab USA (RLABU). Most of these agencies were launched after 1980.
subset(agencies, substr(tstart,1,4) == "-" |
                 substr(tstop,1,4) == "-" |
                 substr(tstop,1,4) == "*" ) %>%
ggplot(aes(y=reorder(agency,as.numeric(substr(tstart,1,4))),
           x=substr(tstart,1,4),
           xend=substr(tstop,1,4),
           fill=agency_type,color=agency_type))+
  geom_dumbbell(size_x = 2,size_xend = 3,size=1.25)+
  xlab("Year")+ylab("Agency")+
  labs(fill="Agency Type",color="Agency Type")+
  theme(axis.text.x = element_text(angle = 90))+
  ggtitle("Start Year and End Year vs Agency If Do Not Know When")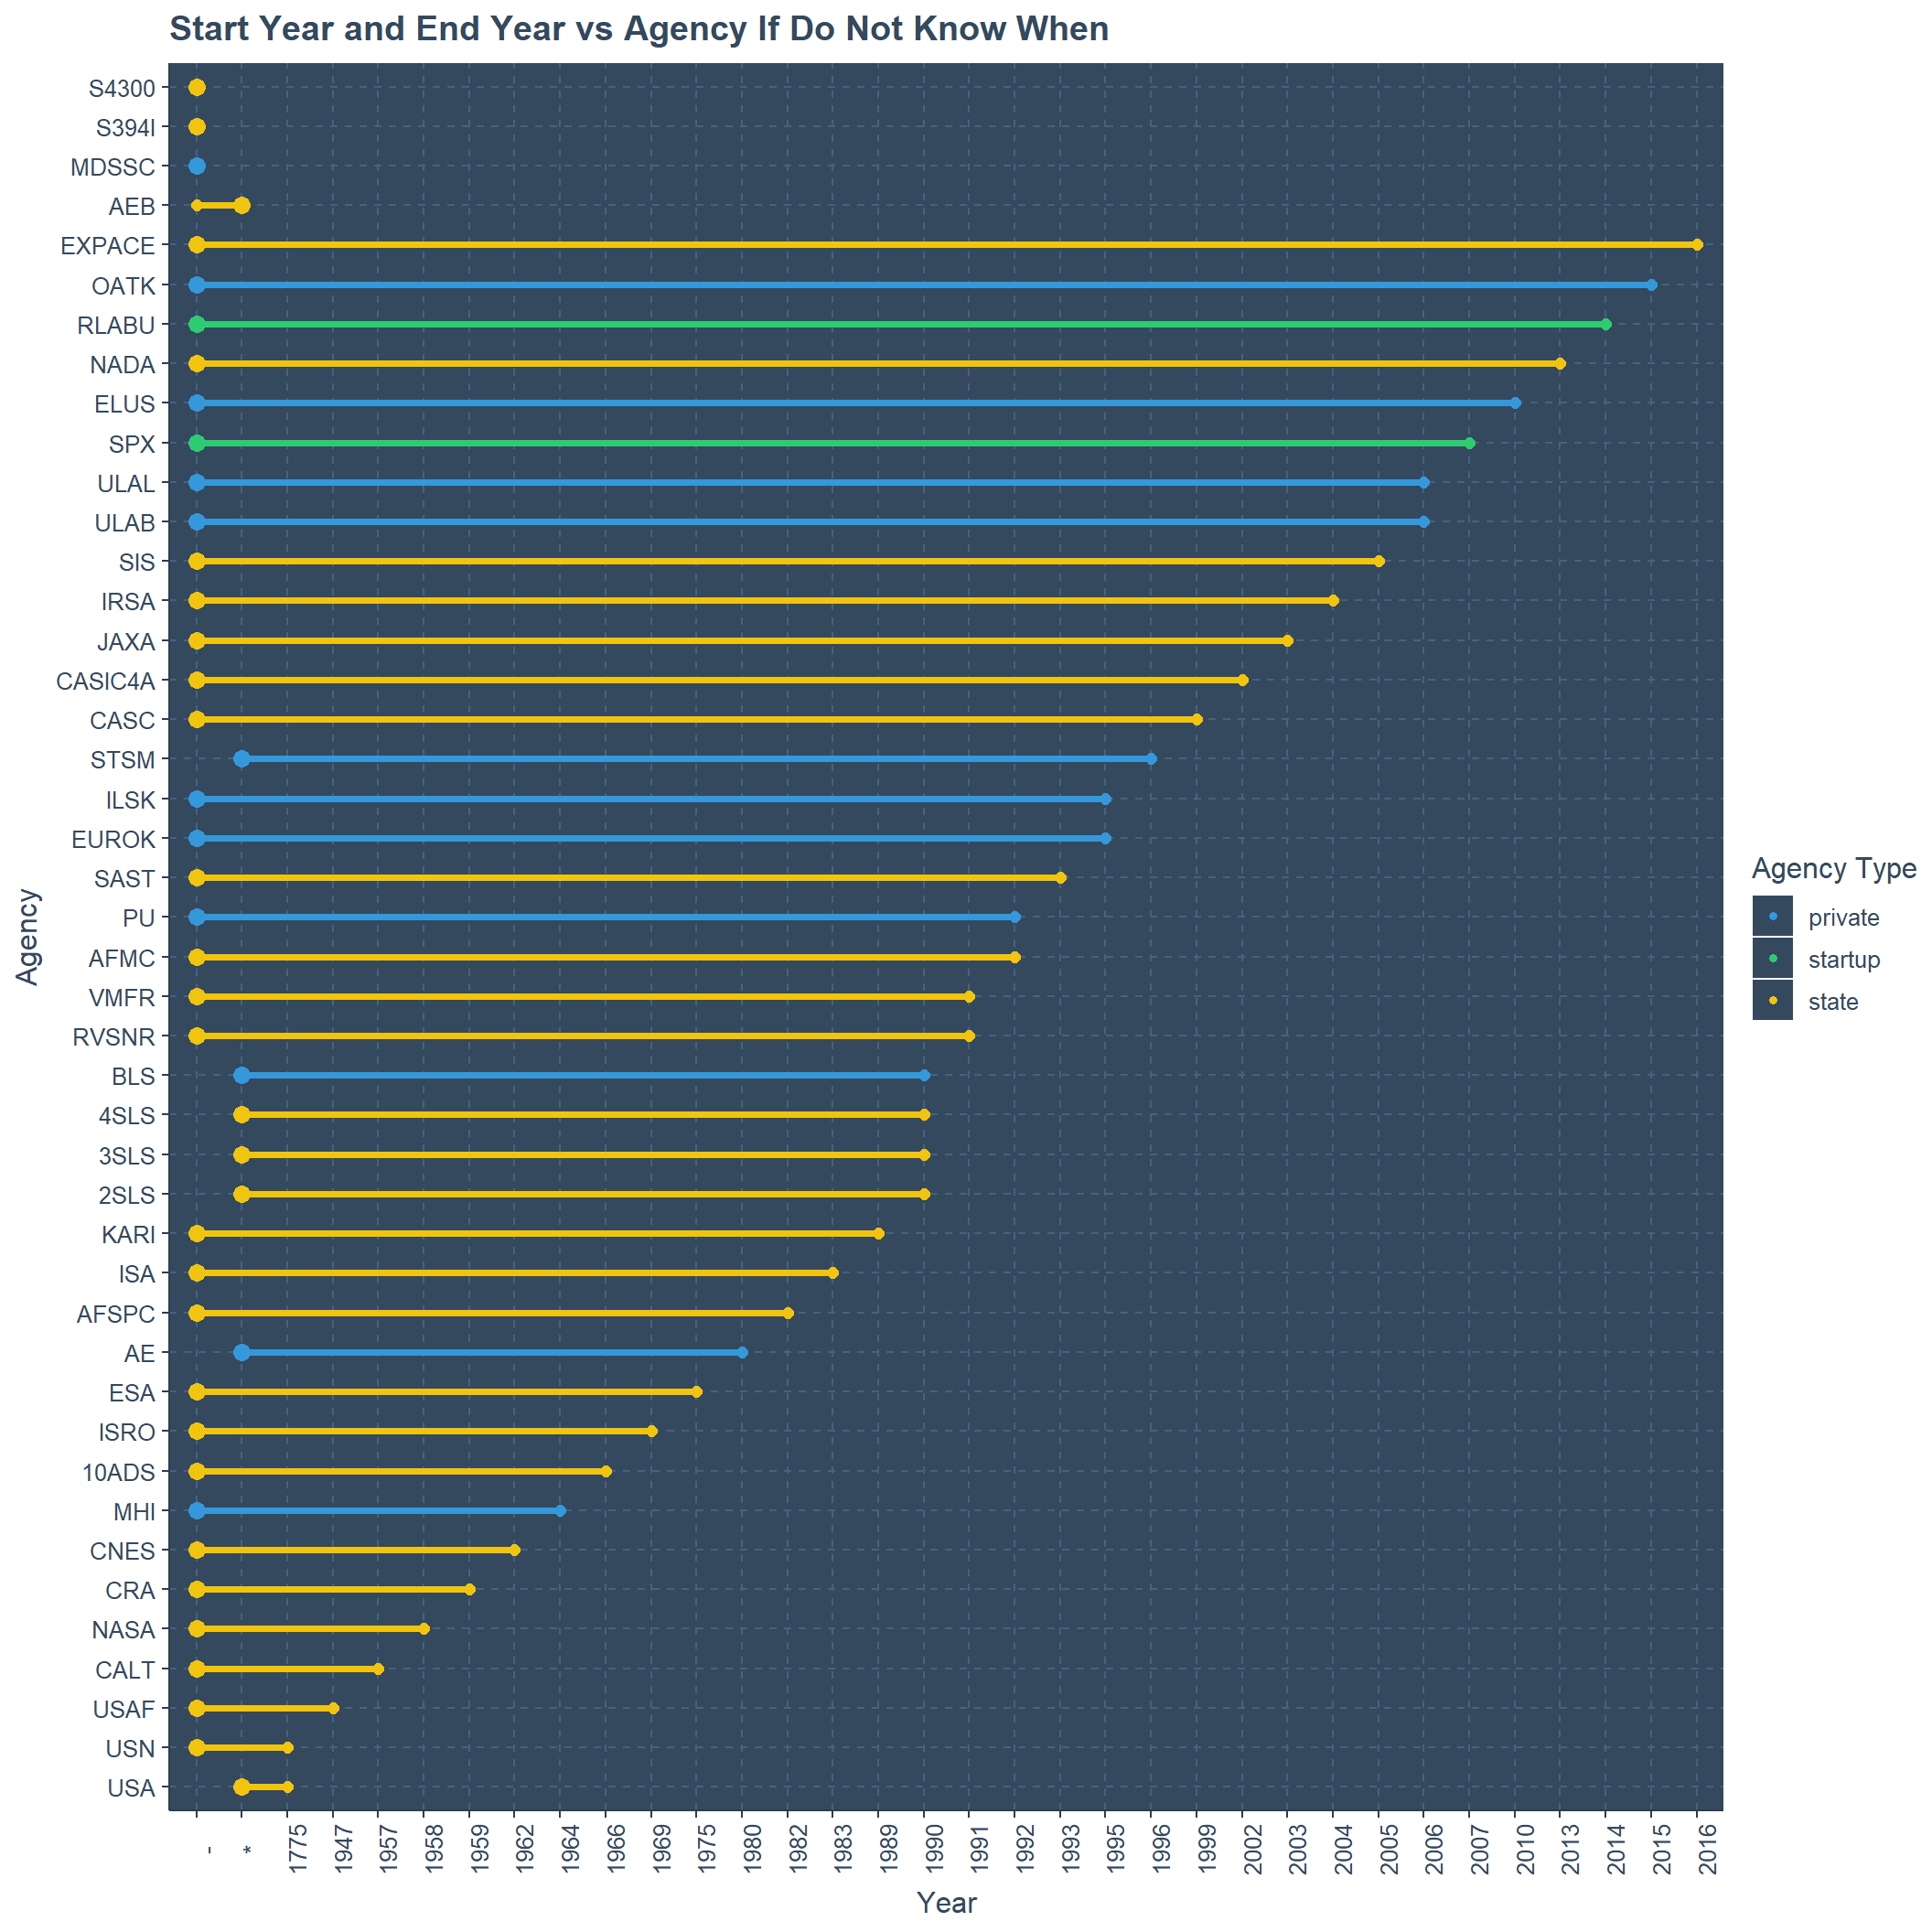
LAUNCHES
Counts of above missions are mentioned here thoroughly.
Success or Failure of these missions vs Category Variables
There are few categorical variables which could be associated with the success or failure of these missions.
Success or Failure vs Launch Year
Less mistakes over the year with technologies improving and in between 1960 to 1990 we can see alot of launches always above 100 per year. This enthusiasm no longer exists until 2005. After 2005 there is positive increase in launches and failures also less.
ggplot(launches,aes(x=factor(launch_year),fill=category))+
  geom_bar()+
  theme(axis.text.x = element_text(angle = 90))+
  xlab("Years")+ylab("Frequency")+
  ggtitle("Years vs Frequency")+
  scale_y_continuous(labels=seq(0,150,10),breaks=seq(0,150,10))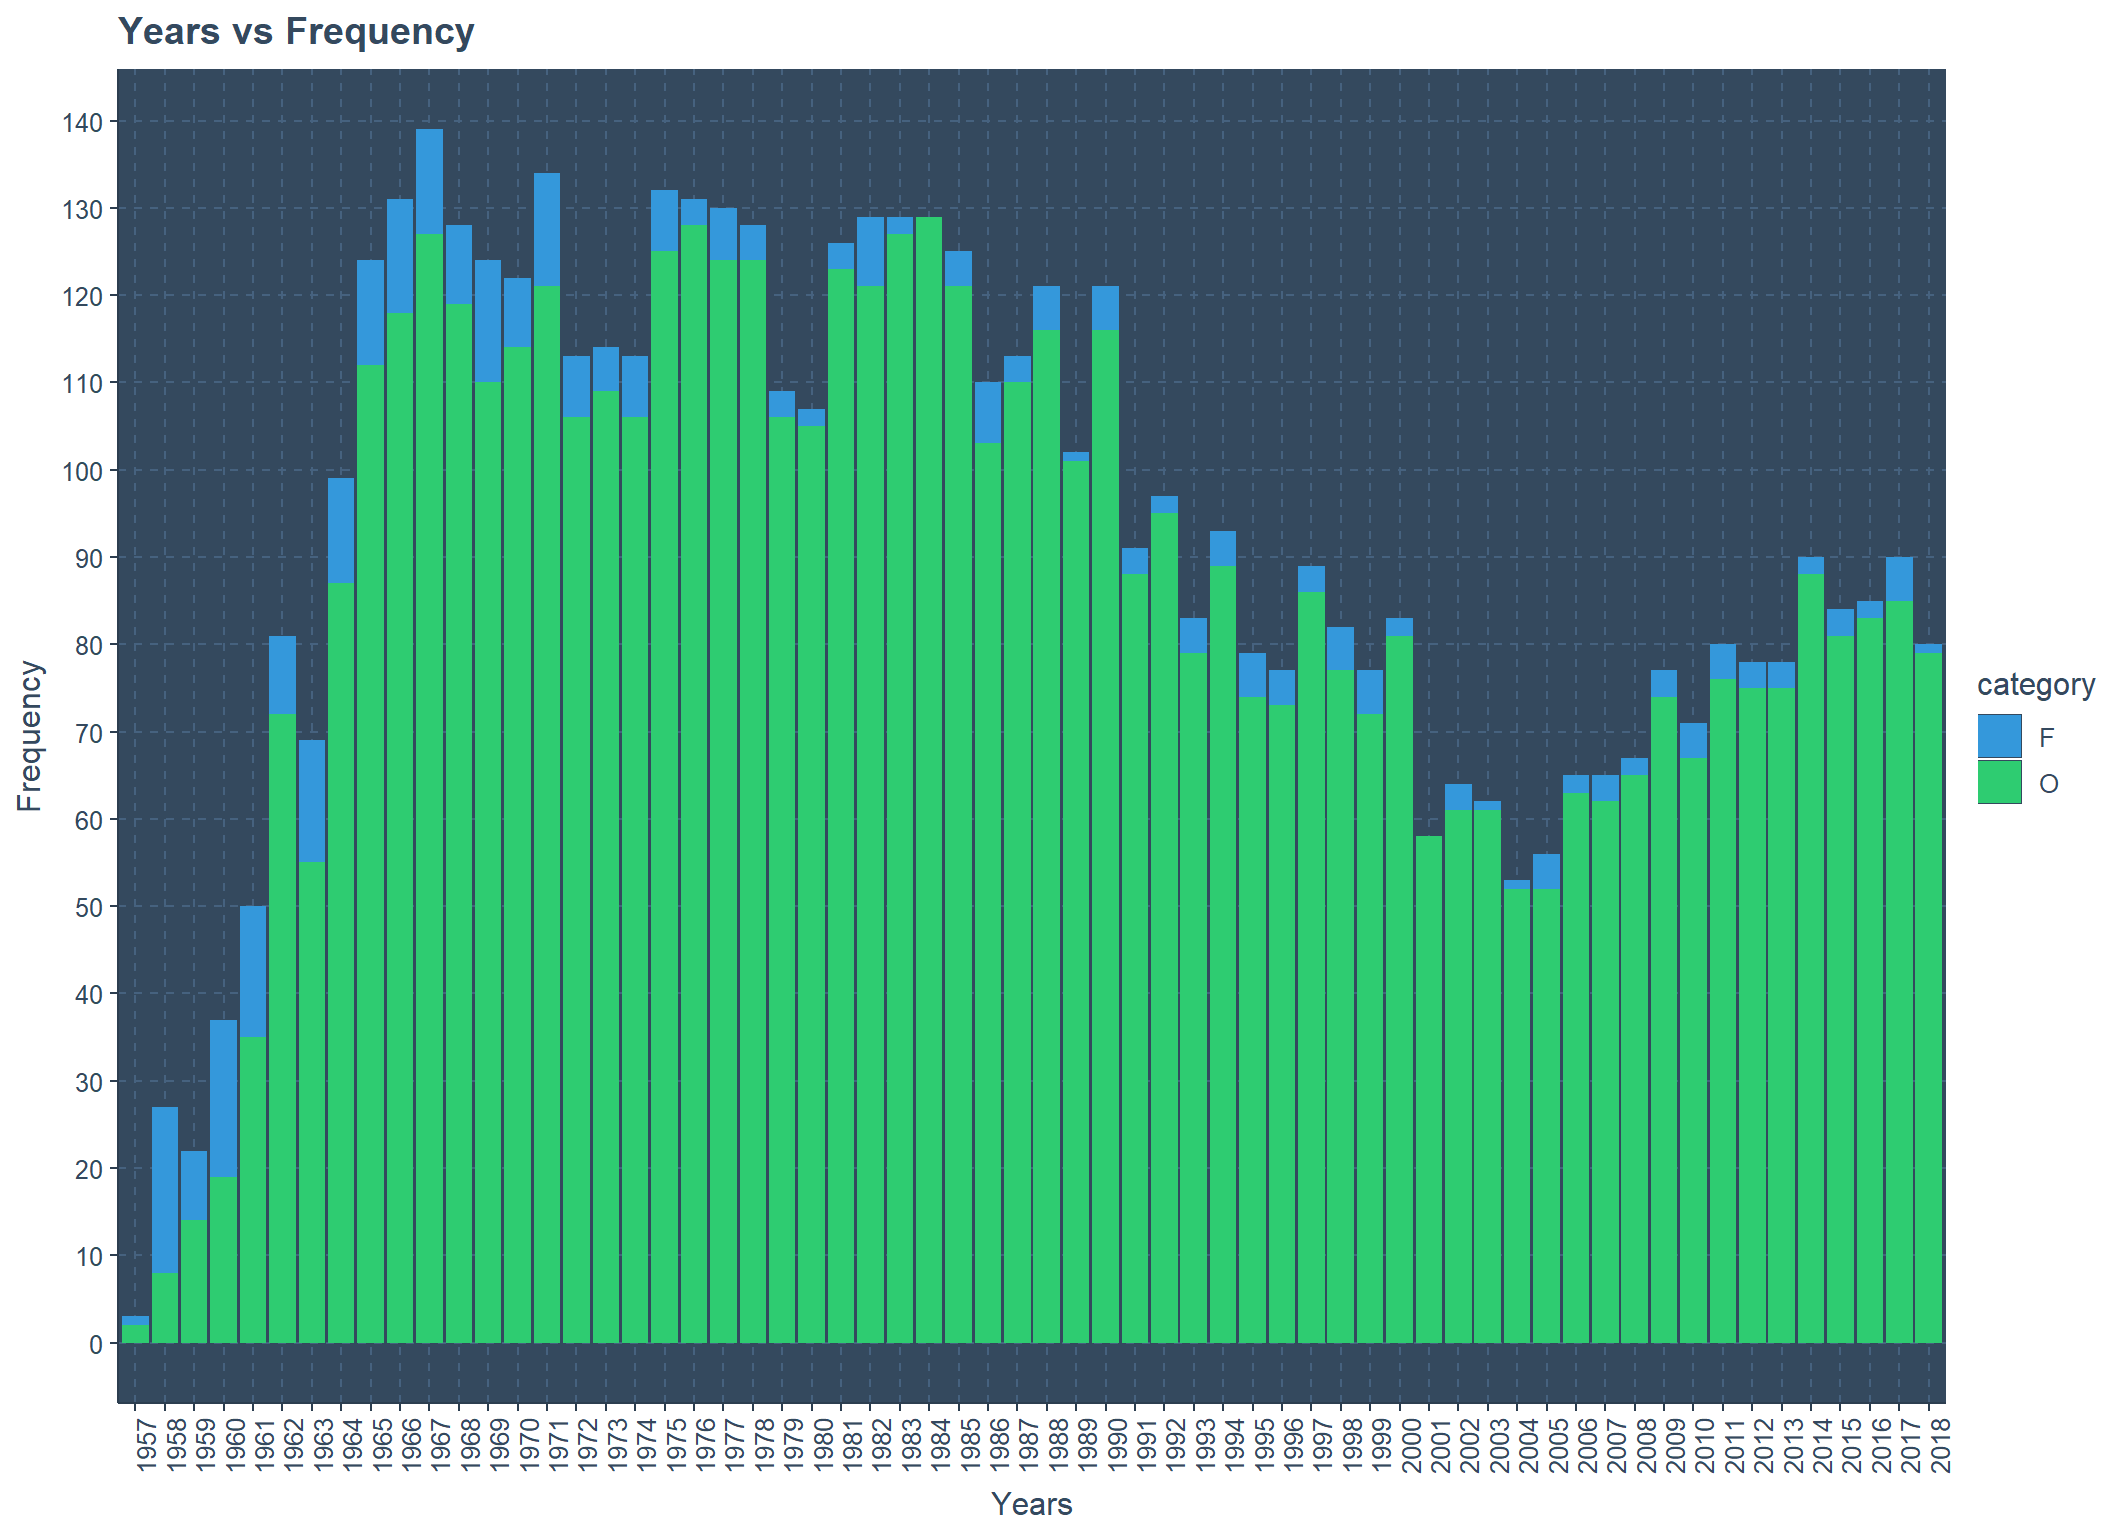
Success or Failure vs Agency Type
State owned agencies has more failures than private and start-ups because it would be costly. More than 4750 launches are from state owned agencies but in them more than 500 launches are failures. Even though private owned agencies has a history from 1990 they have less than 1000 launches.
ggplot(launches,aes(x=fct_infreq(factor(agency_type)),fill=category))+
  geom_bar()+
  xlab("Agency Type")+ylab("Frequency")+
  ggtitle("Agency Type vs Frequency")+
  scale_y_continuous(labels=seq(0,5000,250),breaks=seq(0,5000,250))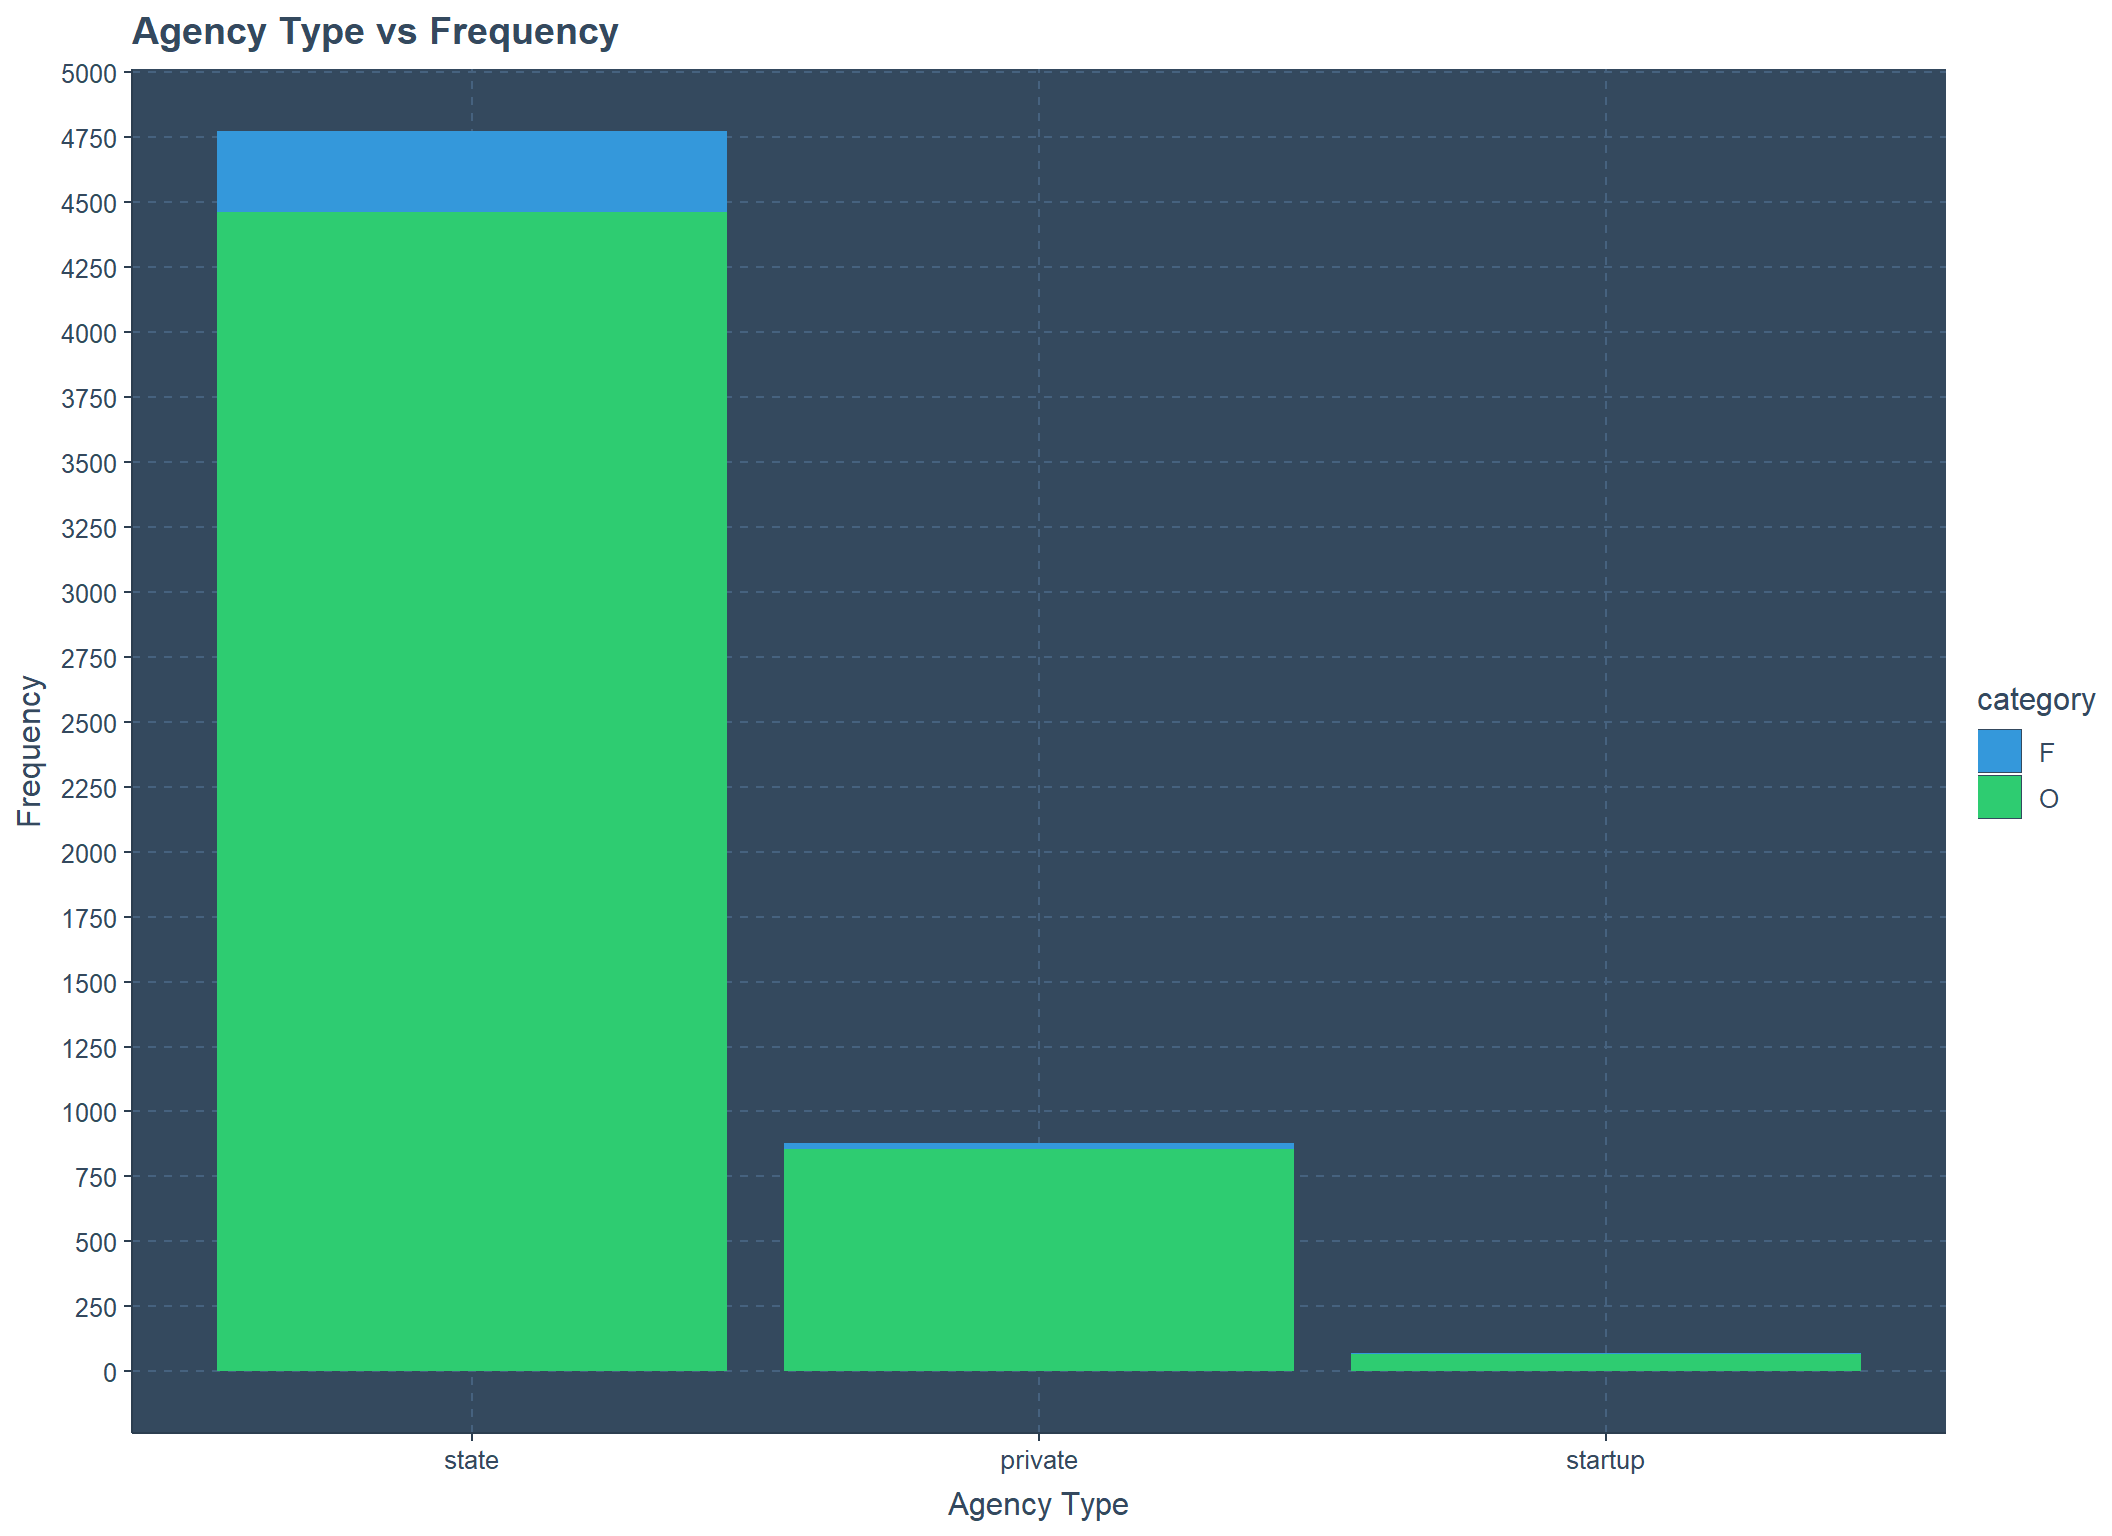
Success or Failure vs State Code
Soviet Union (SU) and United States (US) has the most dominant appearance in this field. More than 2400 launches from SU and for US it is more than 1700 launches. Failures also considerably higher for SU and US.
ggplot(launches,aes(x=fct_infreq(factor(state_code)),fill=category))+
  geom_bar()+
  theme(axis.text.x = element_text(angle = 90))+
  xlab("State Code")+ylab("Frequency")+
  ggtitle("State Code vs Frequency")+
  scale_y_continuous(labels=seq(0,2500,100),breaks=seq(0,2500,100))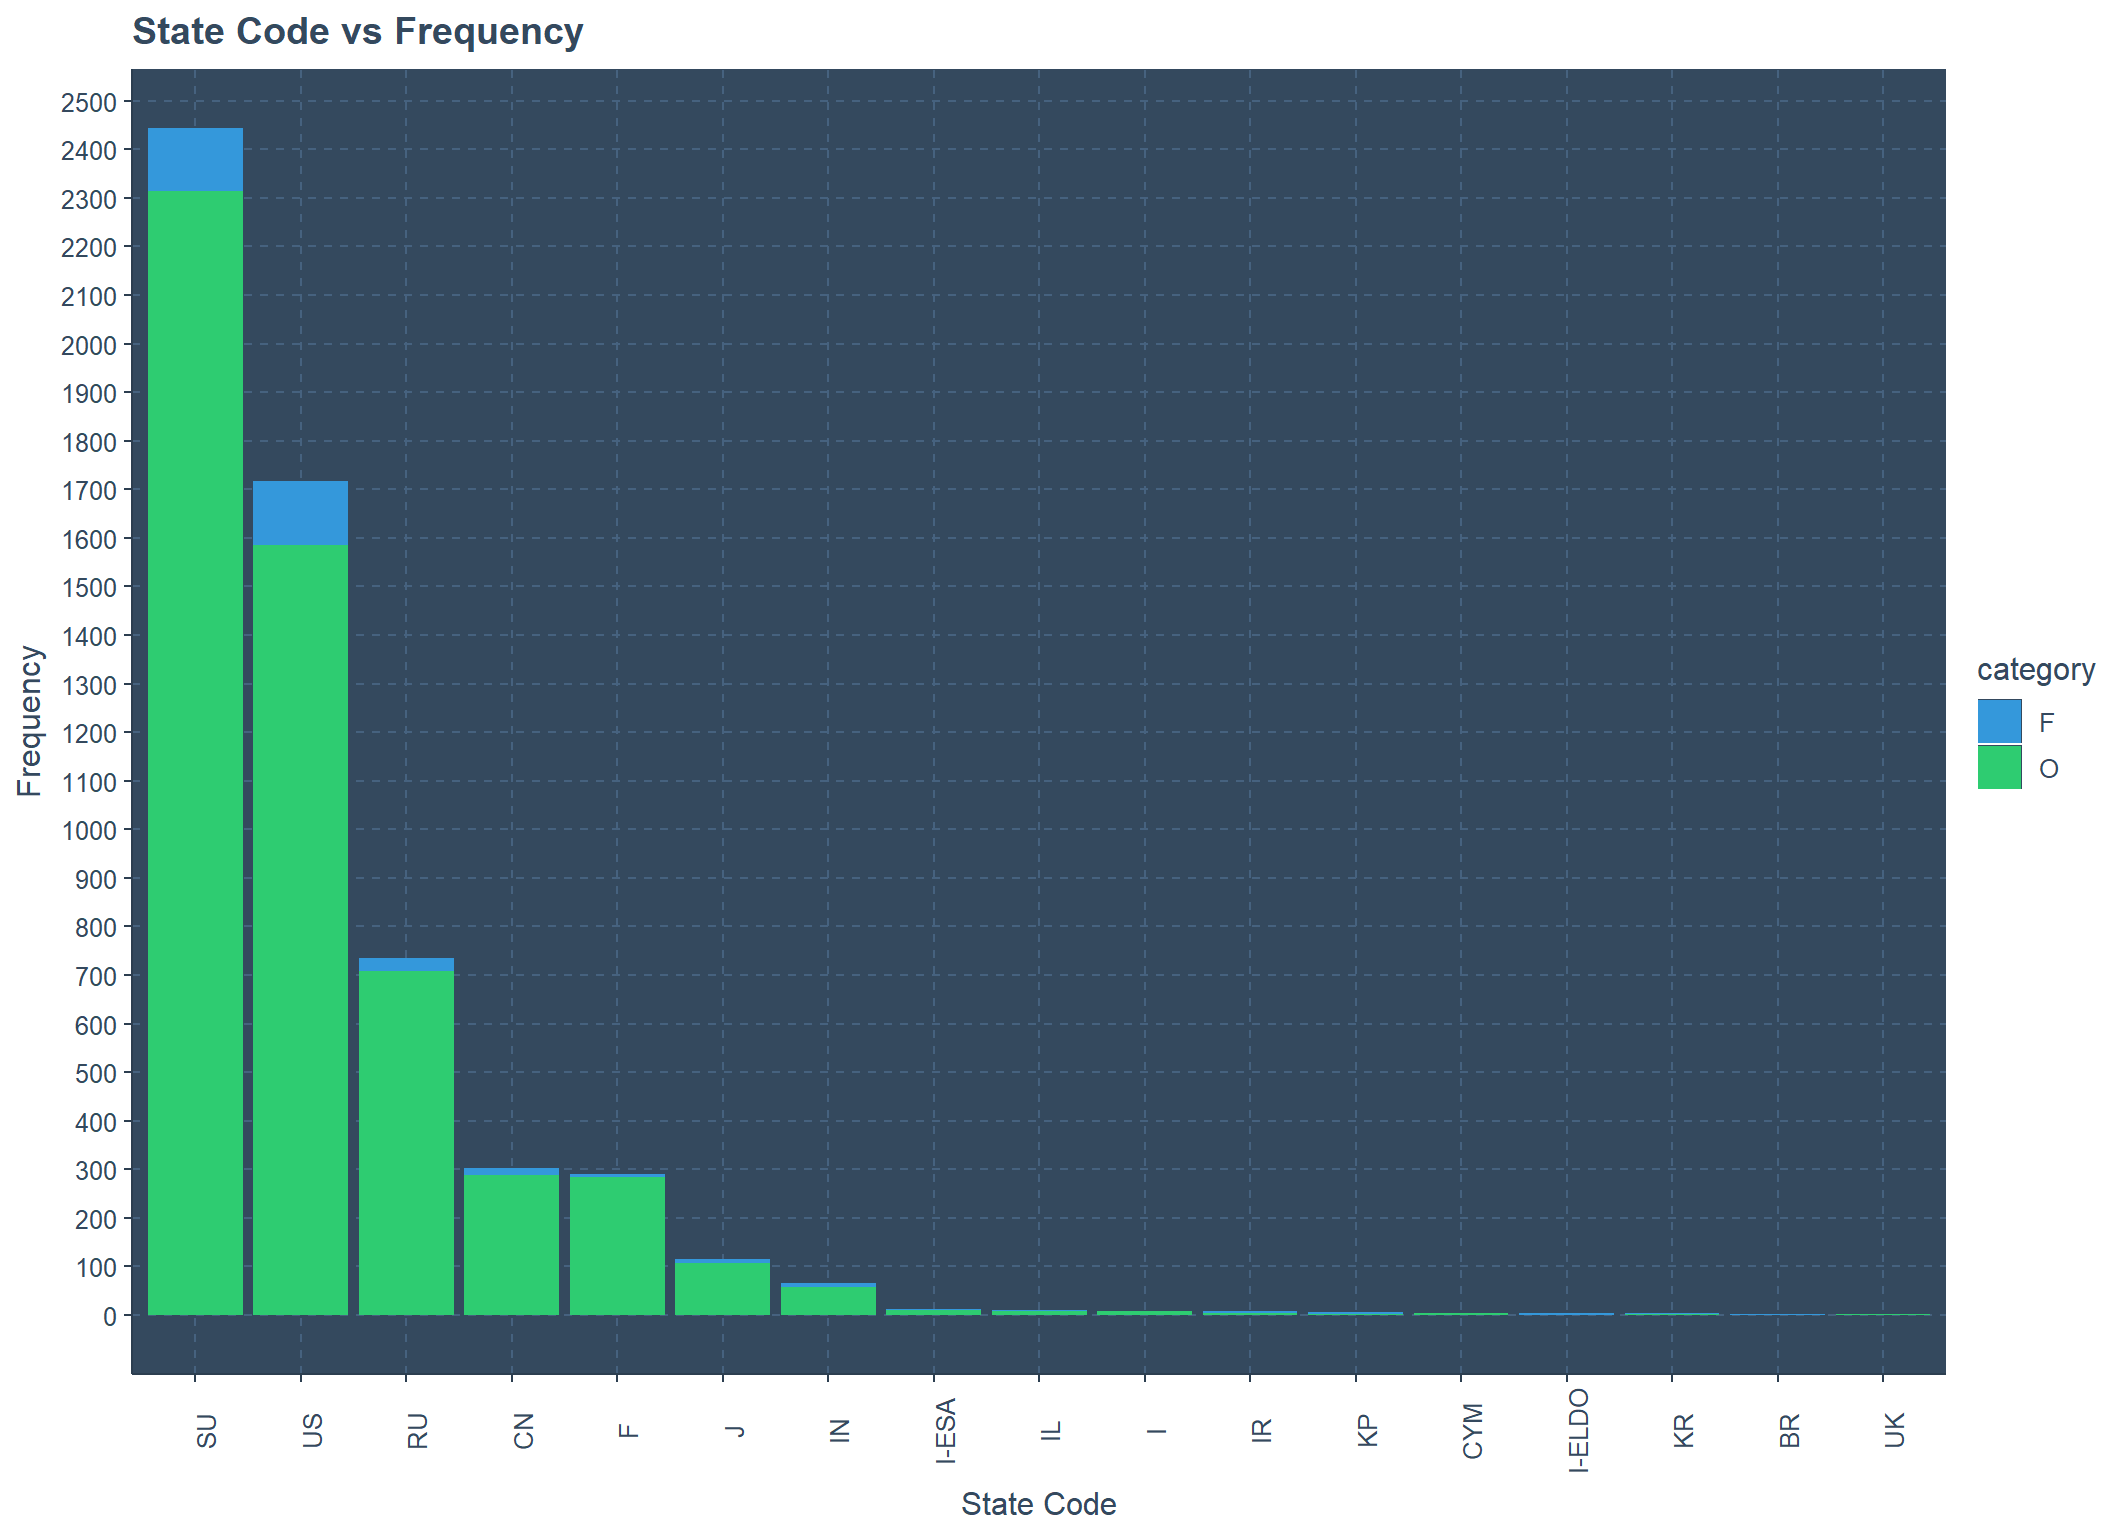
State Code vs Category Over time for Success and Failure
Animated jitter plot here explains how over the years these launches occur based on States and Success(O) or Failure(F).
p<-ggplot(launches,aes(y=category,x=state_code,color=agency_type))+
       geom_jitter()+
       labs(title = "States vs Success or Failure by : {round(frame_time,0)}",
            x="State Code",y= "Success or Failure")+
       transition_time(launch_year)+ease_aes('linear')+
       labs(color="Agency Type")

animate(p,fps=2,duration = 60)
THANK YOU