Introduction
Rshiny is very popular in the rstats community. The glamourous interface and functionality has helped for this level of popularity. In perspective of using an Rshiny App anyone can use it with minimal amount of knowledge. Which is very useful in bringing statistical analysis to consumers or general public without any trouble.
I initially wanted to develop an Rshiny App for my fitODBOD package, but I thought it would be best to test the waters. That is what I have done here. Using the Olympic data from kaggle I have found a very convenient way to understand specific results for a choosen country from the Rshiny App.
 At the beginning I wanted to compare between diferent countries or sports or seasons and come to a conclusion. Well, what kind of a conclusion would make sense bothered me, therefore I turned towards an Rshiny Approach.
This data-set includes information from 1896 to 2016. Analyzing the data-set would take tedious amount of time and in my opinion unnecessary amount of complications will arise when it comes to concluding. Information from the data-set includes about Medals, participants name, country, sports, events, season and year.
Material Useful for Rsiny Development
Easiest way to build your own shiny app is to refer the official website. It provides an extensive amount of information regarding Rshiny development. Already developed Rshiny Apps and Templates are also available, which would come in handy. Further, when you do start an Rshiny App through Rstudio you will initially receive a sample App with its code. A few tweaks and changes would lead to necessary changes that you need.
How To Use The Olympic Rshiny App ?
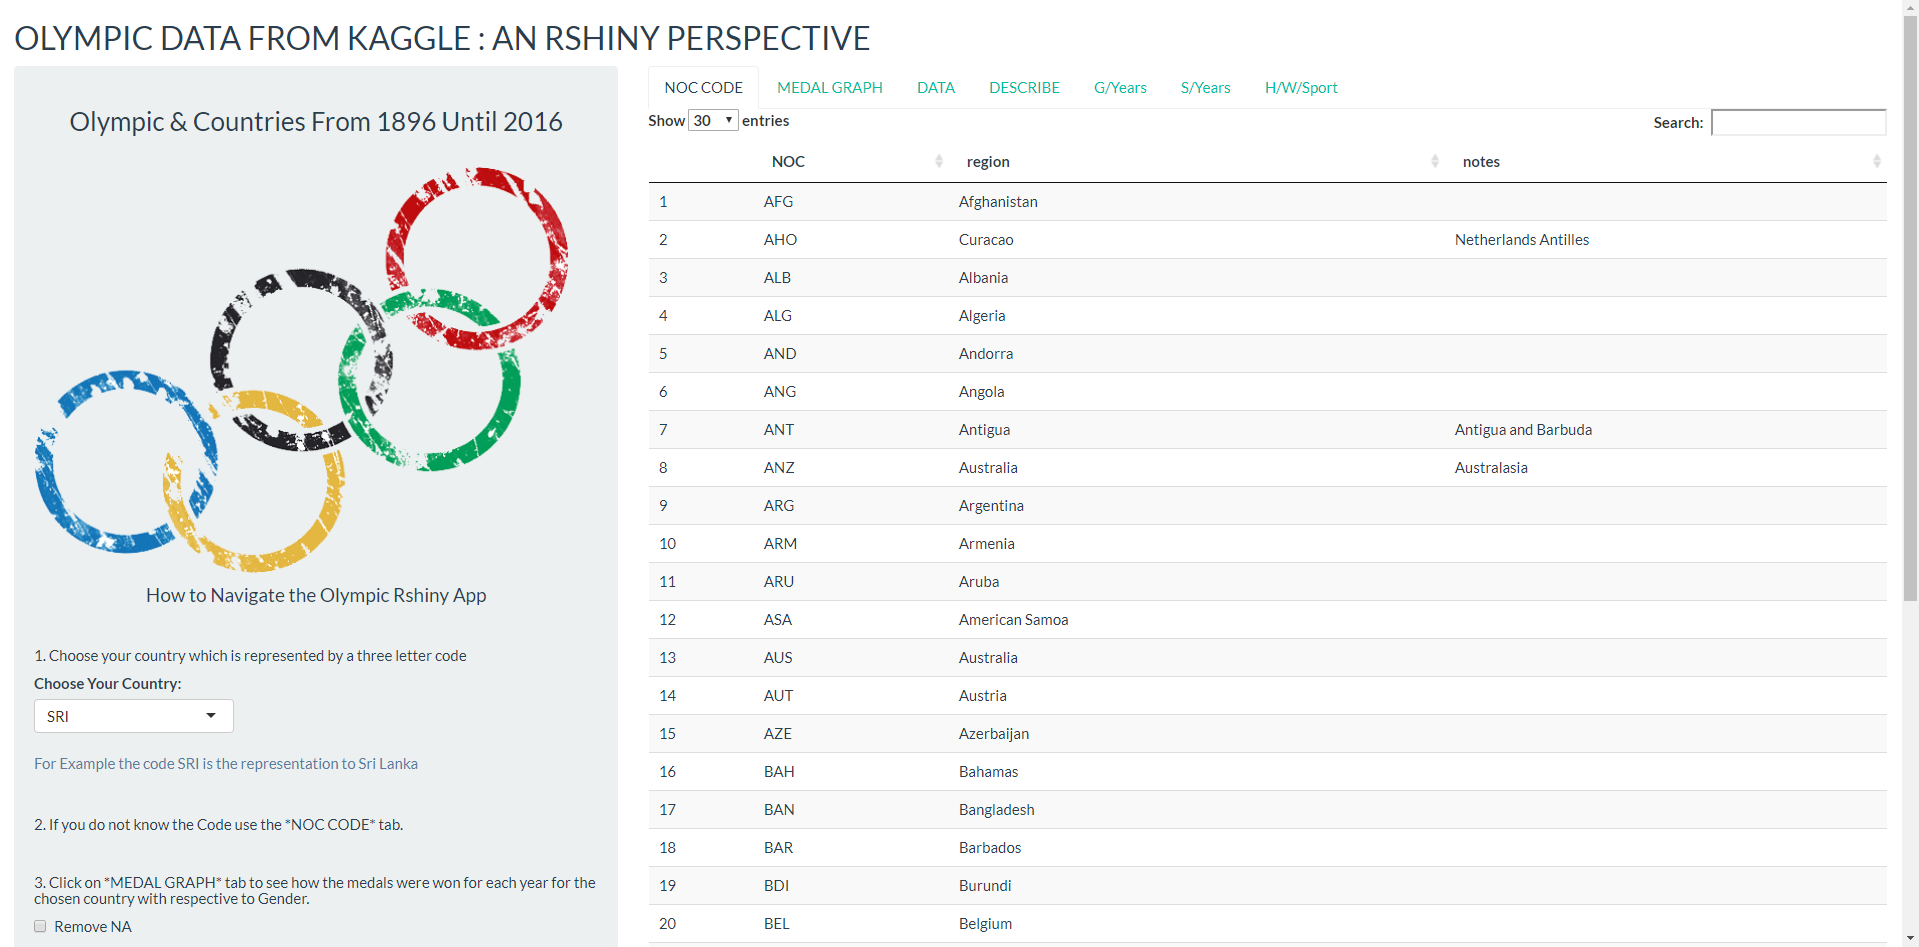
Instructions are also listed in the Rshiny App panel.
Step 1
First Choose a country that you want to study and find the three letter NOC CODE from the “NOC CODE” tab.
Step 2
Choose the “GRAPH” tab to understand how medals were won for a chosen country over the years with respective to Gender.
Step 3
Choose the “DATA” tab to look at the data for the chosen. Further you can scroll through this data and find specific attendee’s Name, Sex, Age, Year, Season, City, Sport, Event and Medal.
Step 4
Using “DESCRIBE” tab you can simply study the descriptive statistics for the data of the chosen country.
Step 5
“G/Years” tab is there to explain the Gender representation over the years of the chosen country through a bar plot.
Step 6
“S/Years” tab shows a bar plot which has the representation of the Gender of the Sports event participants of the chosen country.
Step 7
“H/W/Sport” tab explores how participants Height and Weight relationship for each Sporting event with respective to Gender for the chosen country.
Step 8
Repeat the Steps 1 to 7 and be amused of the results from different countries.
PLEASE NOTE - You should remember that as a user of this Rshiny Application not all countries have won atleast one medal at the Olympics. At these occurences “MEDAL GRAPH” tab does not show any graph but only an error. This can be confirmed by the “DESCRIBE” tab which will produce the summary for that chosen country.
THANK YOU