My package fitODBOD

Publications

Filter by type:

Presidential Election Data of Sri Lanka has been in PDF files until this project was finished. While a Presidential Election is close by it would be useful to have all the data regarding Presidential Elections from the beginning(1982). Over the seven elections we can thoroughly study how Sri Lankan community has voted based on political parties and interest. Further, this data could be used to the upcoming election as well. Future projects can be of similar idea while converting pdf files of Parliamentary and Local Elections to data-frames.
Presidential Election, 2019

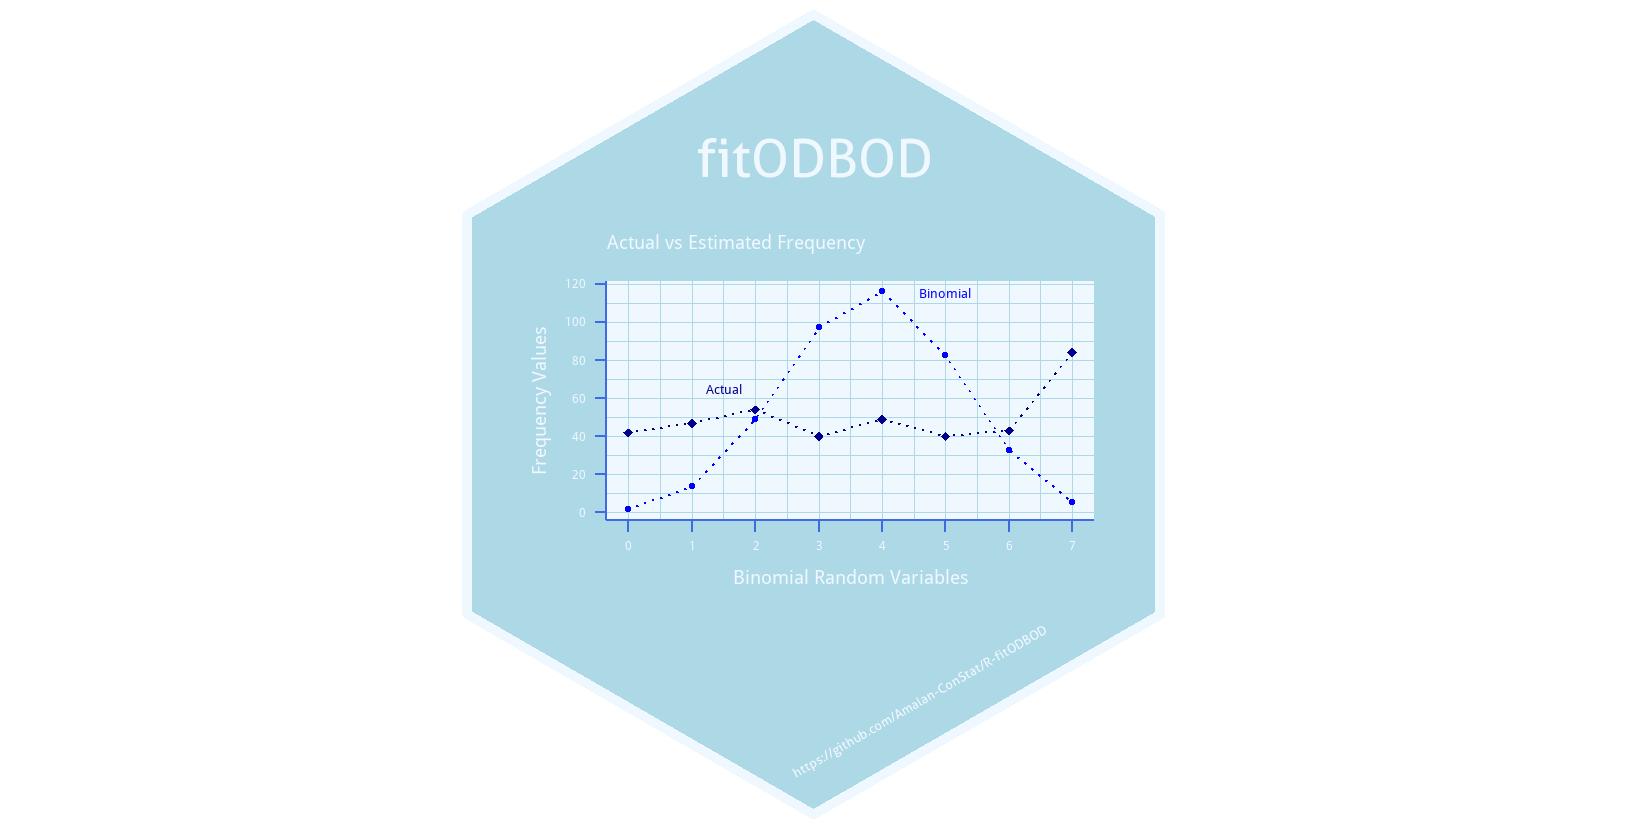
The R package fitODBOD can be used to identify the best-fitting model for Over-dispersed Binomial Outcome Data(BOD).The Triangular Binomial(TriBin),Beta-Binomial(BetaBin), Kumaraswamy Binomial (KumBin), Gaussian Hypergeometric Generalized Beta-Binomial (GHGBB), Gamma Binomial (GammaBin), Grassia II Binomial (GrassiaIIBin) and McDonald Generalized Beta-Binomial (McGBB) distributions in the Family of Binomial Mixture Distributions (FBMD) are considered for model fitting in this package. Alternate Binomial Distributions such as Additive Binomial (AddBin), Beta-Correlated Binomial (BetaCorrBin), COM Poisson Binomial (COMPBin), Correlated Binomial (CorrBin), Lovinson Multiplicative Binomial (LMBin) and Multiplicative Binomial (MultiBin) distributions are used as well, replacing the traditional binomial distribution. Further, Probability Mass Function (PMF), Cumulative Probability Mass Function (CPMF), Negative Log Likelihood, Over-dispersion and parameter estimation (shape and distribution distinct parameters) can be explored for each fitted model with the fitODBOD package.
fitODBOD, 2019

Every year when the package is updated, website will be updated as well with the newest helpful documents to explain how the fitODBOD package works.
fitODBOD, 2019

There are two repositories, where one is mirrored by CRAN. The R-fitODBOD version which is under full supervision by me to resolve issues.
fitODBOD, 2019

Version 1.1.0 with nine distributions, but in version 1.2.0 it was increased to eleven distributions. Version 1.3.0 now has fourteen distributions.
fitODBOD, 2019

Meta analysis was conducted by me for the provided data using the packages meta and metafor from R statistical programming software. In the full article the package versions are clearly mentioned. Data was used to generate forest plots, funnel plots and find the prevalence rates. This article is published in the most prestigious Journal of Epidemiology and Community Health of BMJ Journals.
Meta-Analysis, 2019

This is a least viable product of R package for fitting Binomial outcome data, and an abstract, extended articles were written in related to this minimum viable product.
fitODBOD, 2018