wwc_outcomes <- readr::read_csv("https://raw.githubusercontent.com/rfordatascience/tidytuesday/master/data/2019/2019-07-09/wwc_outcomes.csv")
squads <- readr::read_csv("https://raw.githubusercontent.com/rfordatascience/tidytuesday/master/data/2019/2019-07-09/squads.csv")
codes <- readr::read_csv("https://raw.githubusercontent.com/rfordatascience/tidytuesday/master/data/2019/2019-07-09/codes.csv")

library(ggplot2)
library(gganimate)
library(dplyr)
library(tvthemes)Most of these players are in between 23 and 29, also US women team players have scored a lot goals internationally.
— Amalan Mahendran (@Amalan_Con_Stat) July 10, 2019
GitHub Code: https://t.co/CHpOfgsdsZ #TidyTuesday pic.twitter.com/oKCDpjeLen
Squads
Captain-ship vs Goals
p1<-ggplot(squads,aes(caps,goals,color=pos,label1=player,label2=country,group=1))+geom_point()+
    ylab("No of Goals Scored")+xlab("No of Matches as Captains")+
    ggtitle("Relationship Between Goals Scoring and Captain-ship",
            subtitle = "This is plotly so click on the points on legend")+
    theme_parksAndRec()+labs(color="Position")

plotly::plotly_build(p1)
Age vs Goals
p1<-ggplot(squads,aes(age,goals,color=pos,label1=player,label2=country,group=1))+geom_point()+
    xlab("Age of the Player")+ylab("No of Goals Scored")+
    ggtitle("Relationship Between Goals Scoring and Age",
            subtitle = "This is plotly so click on the points on legend")+
    theme_parksAndRec()+labs(color="Position")

plotly::plotly_build(p1)
Country and Positions
squads %>%
  group_by(country,pos) %>%
  count() %>%
  ggplot(.,aes(country,n,fill=pos,label=n))+geom_col()+
         theme_parksAndRec()+labs(fill="Position")+
         xlab("Country")+ylab("Count of Players")+geom_text(position = "stack",vjust=1)+
         ggtitle("Positions and their counts according to Country")+
         theme(axis.text.x = element_text(angle = 90,vjust=0))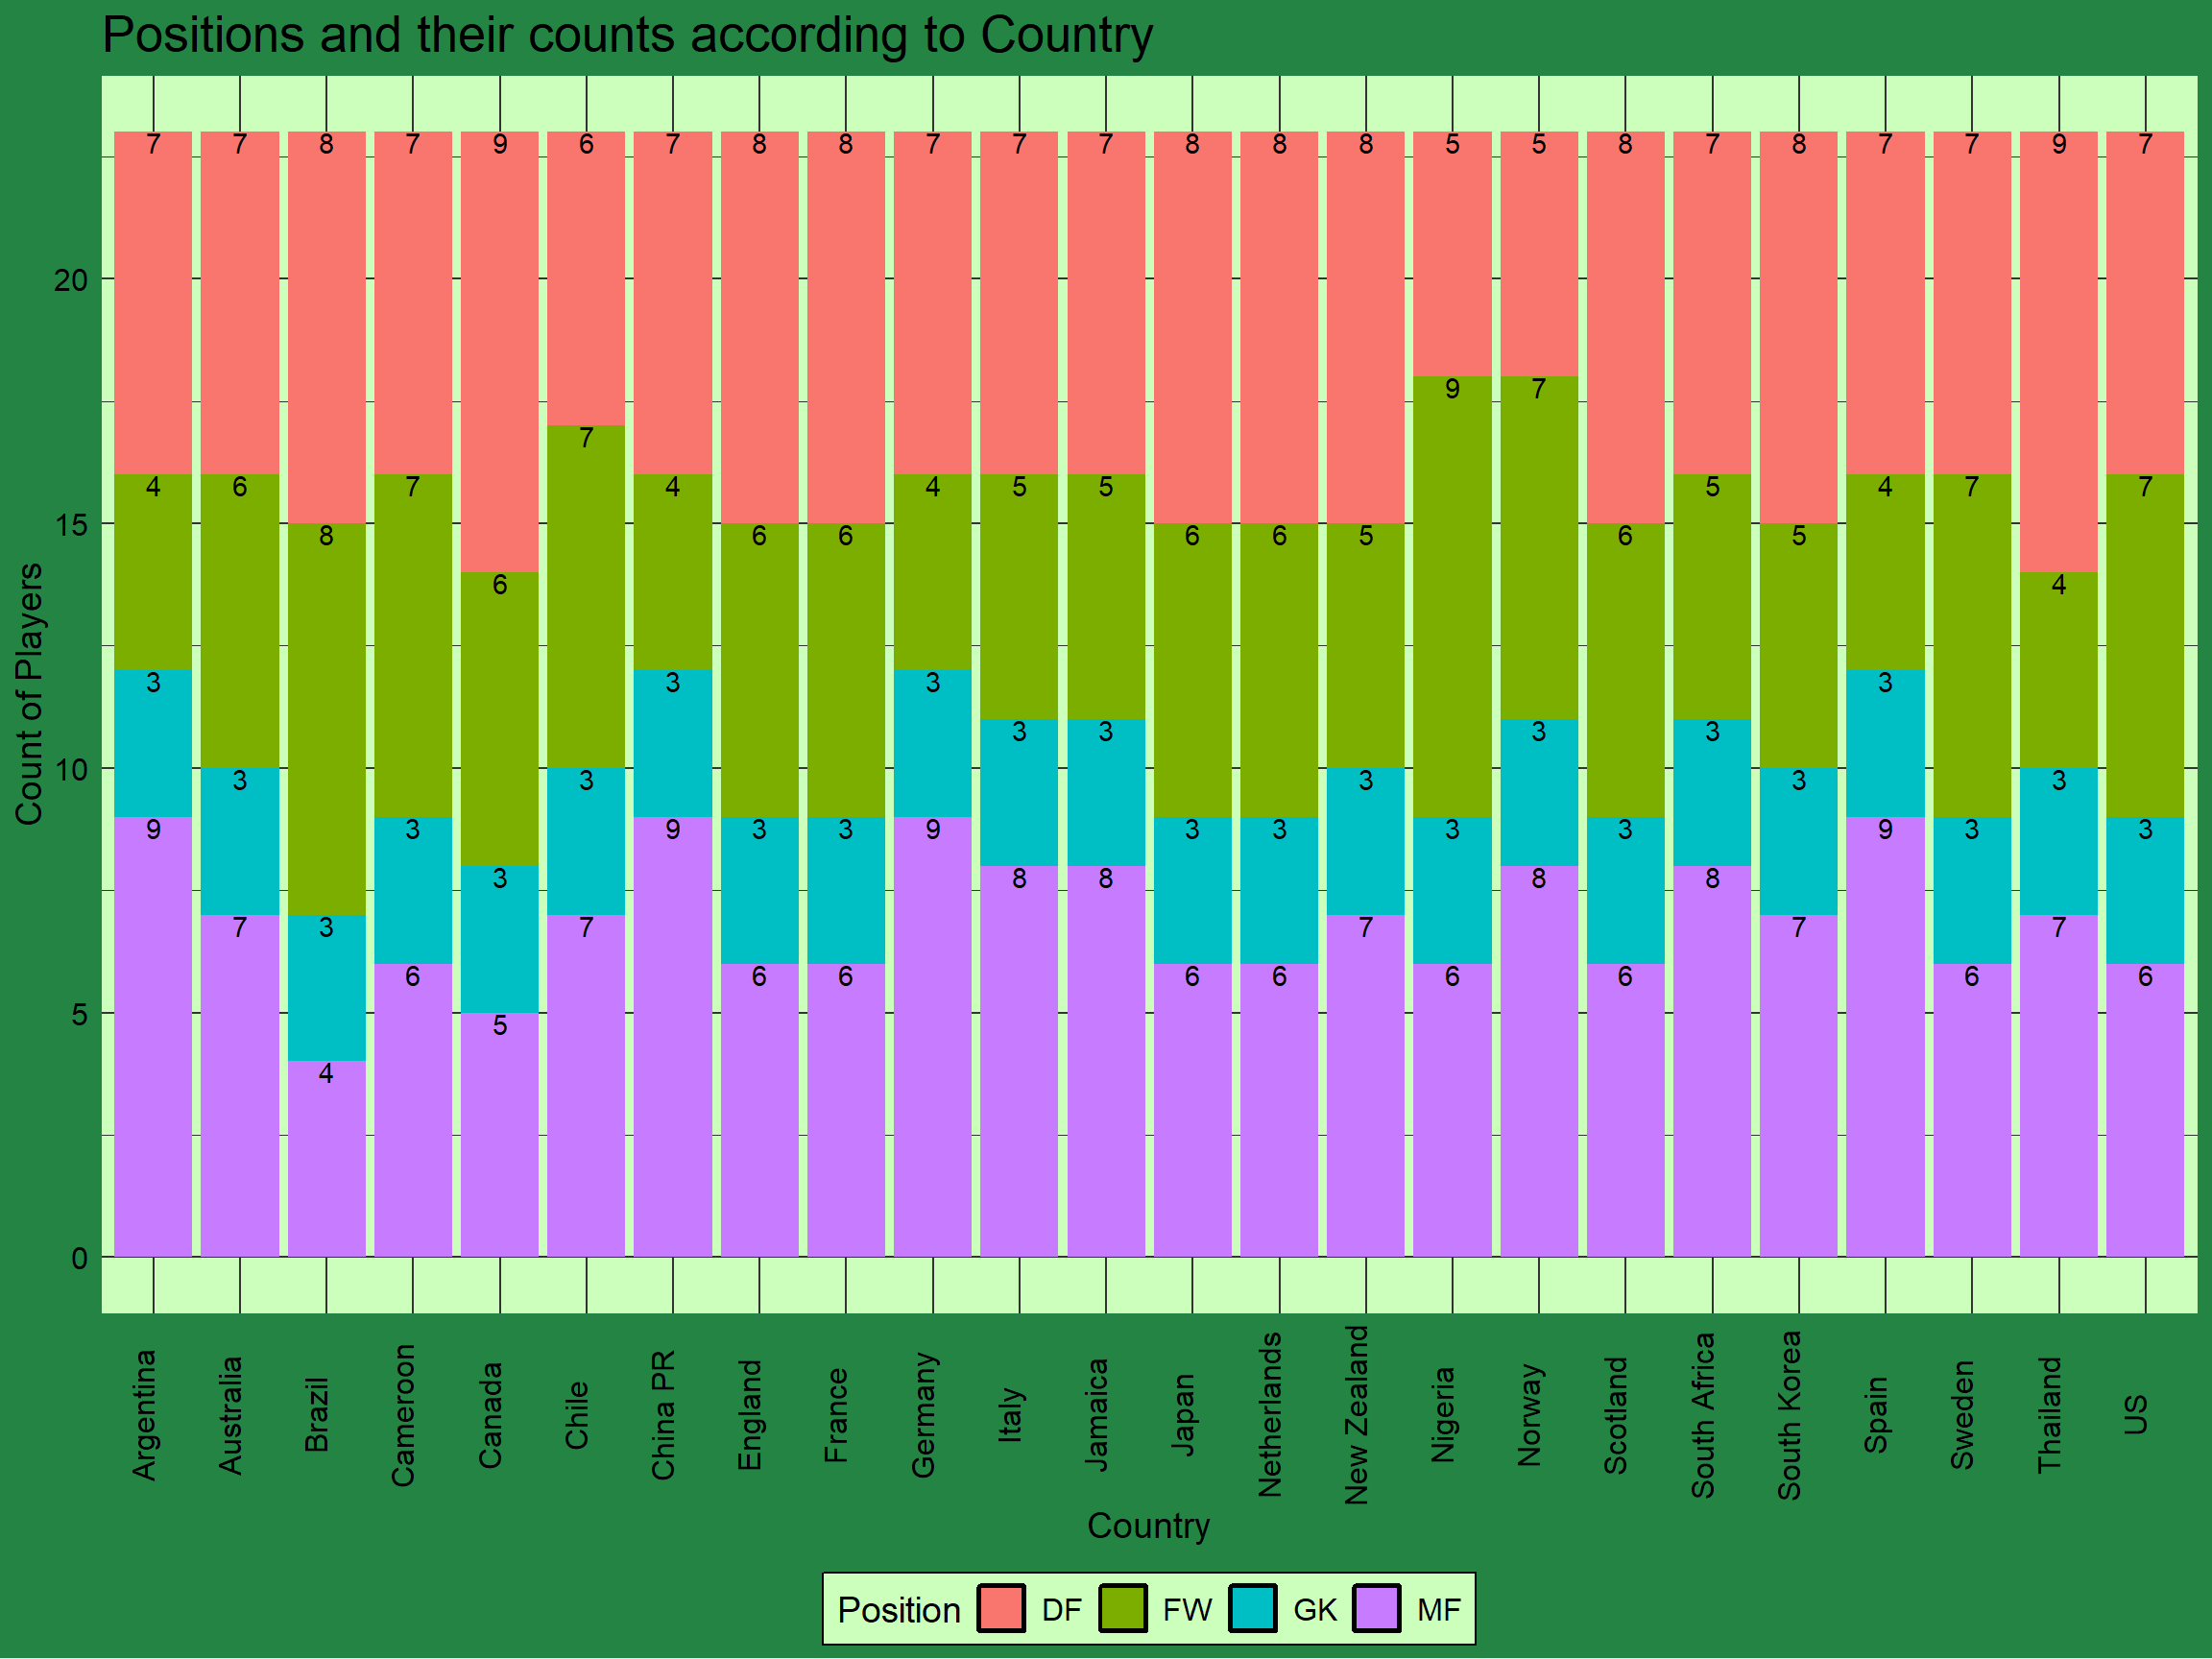
Age and Positions
squads %>%
  group_by(age,pos) %>%
  count() %>%
  ggplot(.,aes(factor(age),n,fill=pos,label=n))+geom_col()+
         xlab("Age")+ylab("Count of Players")+geom_text(position = "stack",vjust=1,size=3.5)+
         ggtitle("Positions and their counts according to Age")+
         theme_parksAndRec()+labs(fill="Position")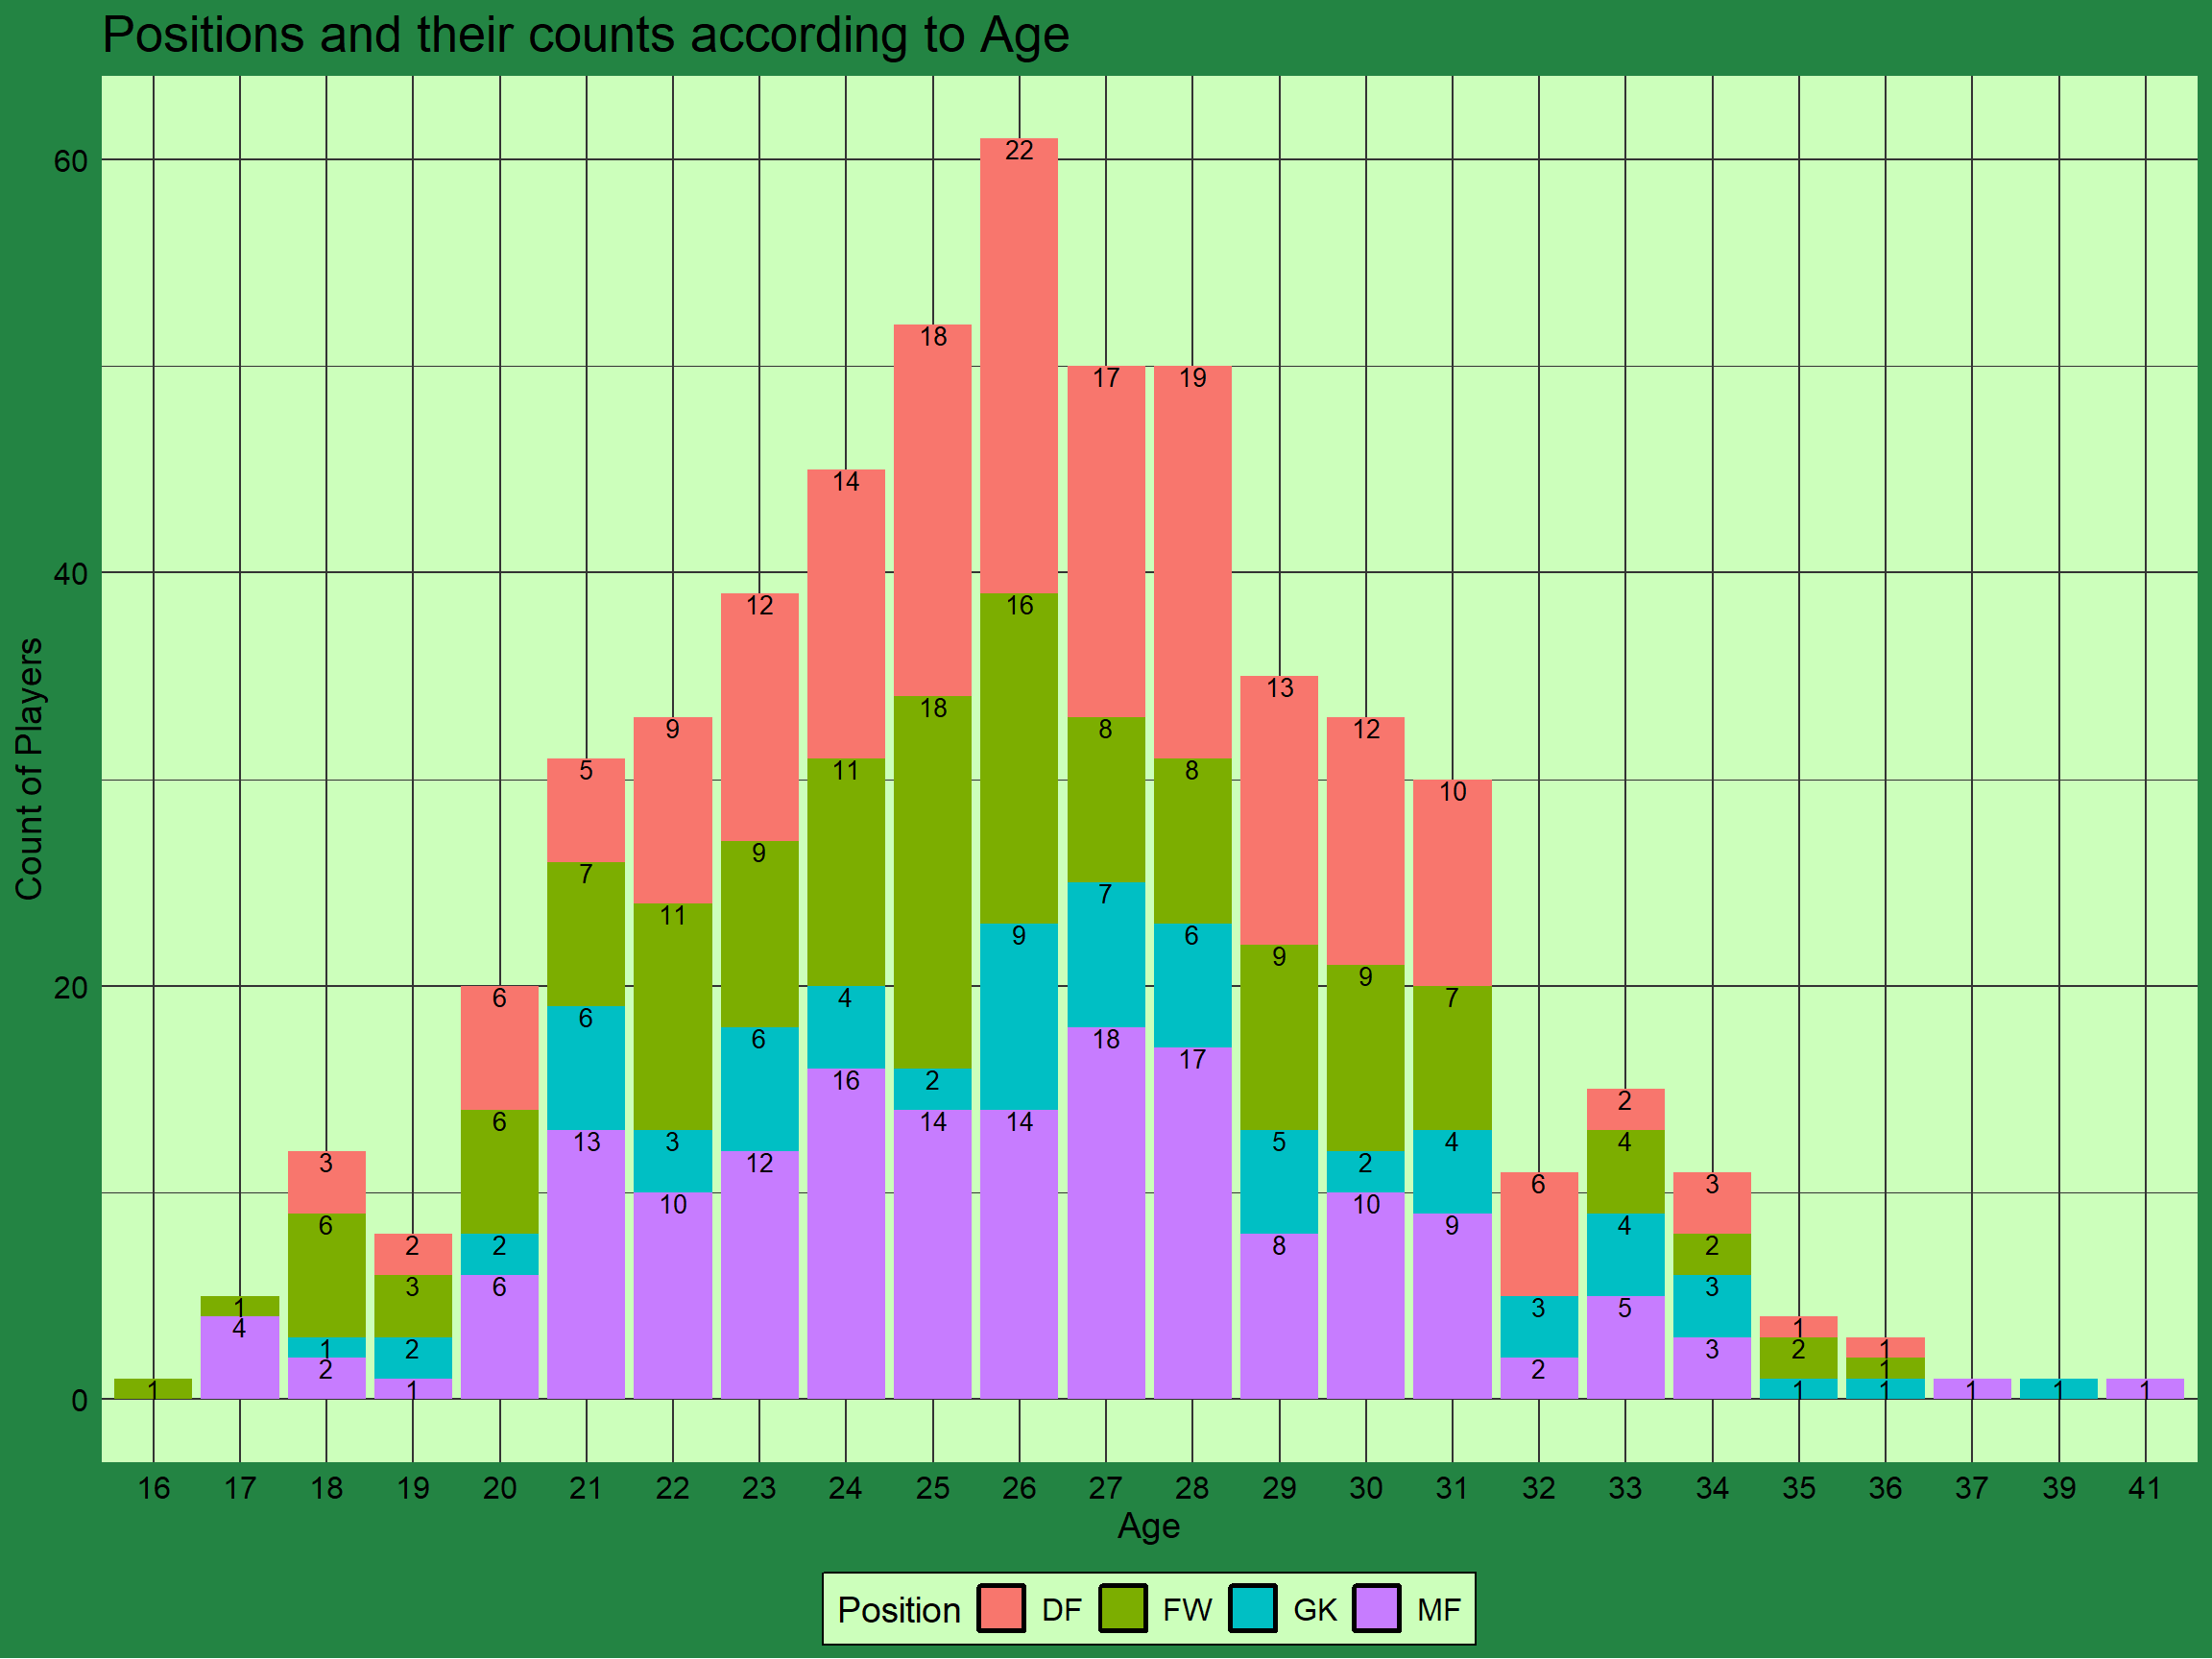
Country and Age Distributions
ggplot(squads,aes(age,country))+
       ggridges::geom_density_ridges(scale=1.45,jittered_points=TRUE,fill="green",alpha=0.8)+
       theme_parksAndRec()+
       scale_x_continuous(breaks=seq(10,45,5),labels=seq(10,45,5))+
       scale_y_discrete(expand = c(0, 1))+
       xlab("Age")+ylab("Country")+
       ggtitle("Country vs Age Distribution")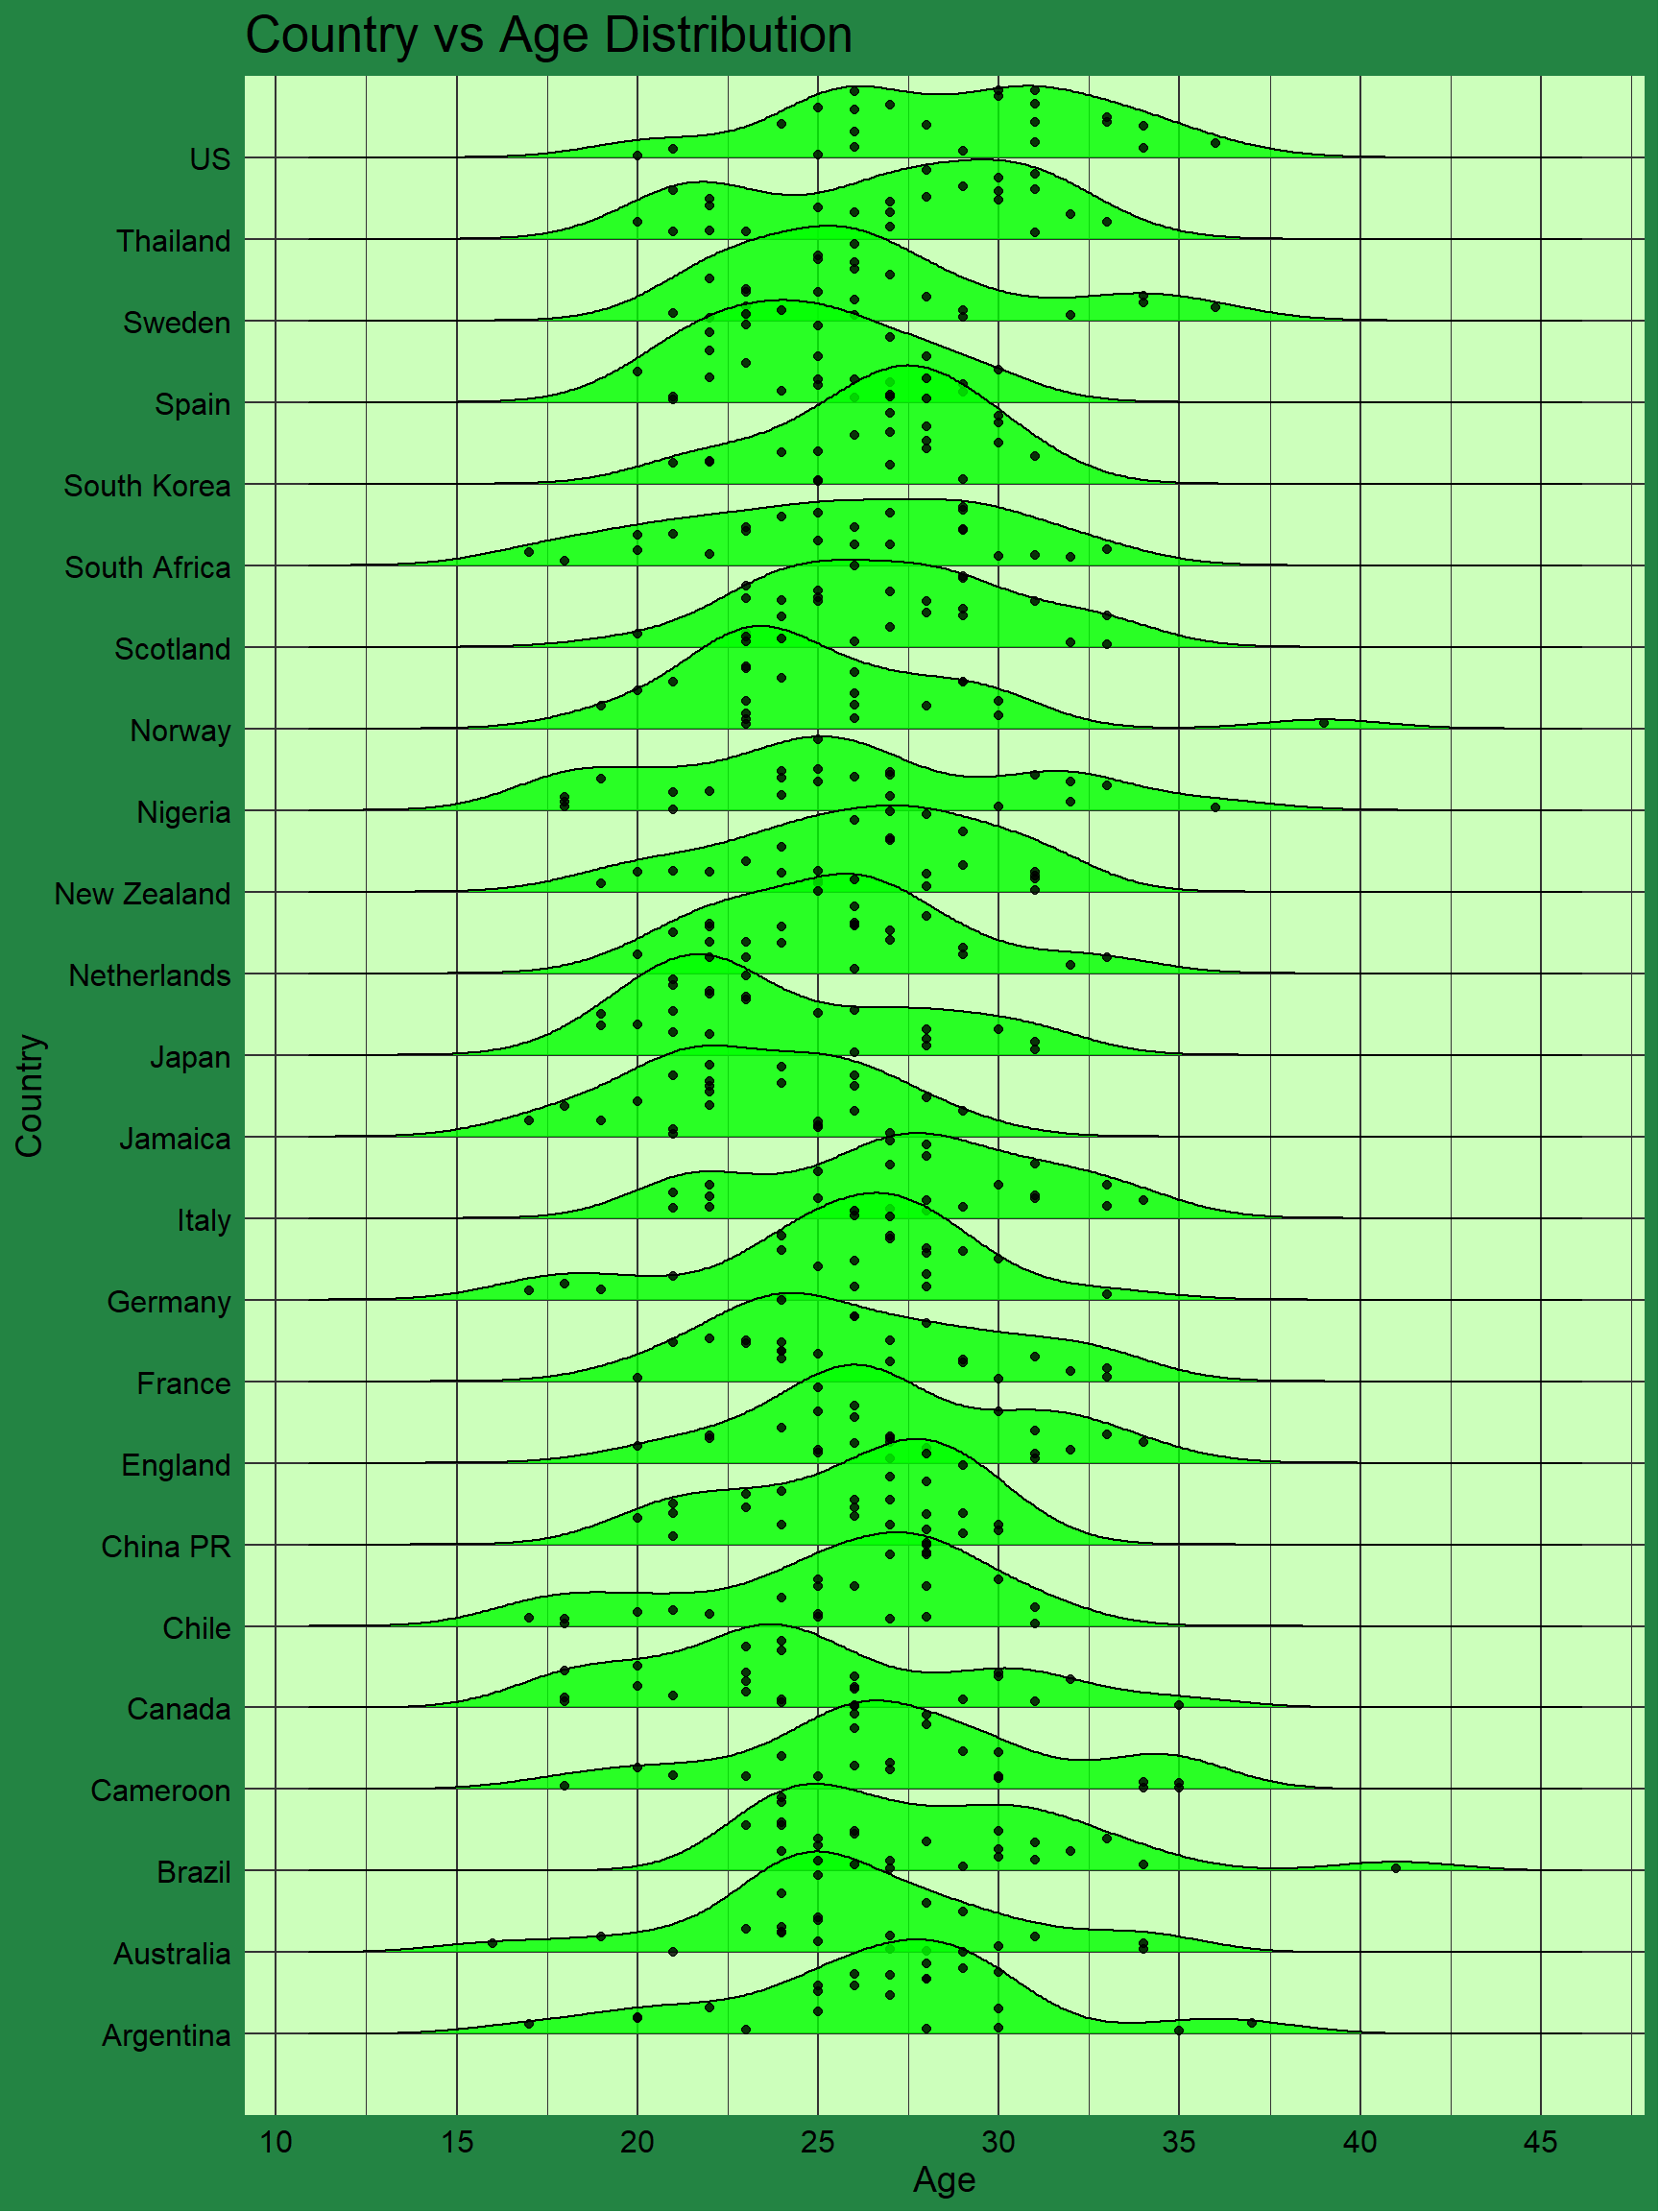
Country and Goal Experience
squads %>%
  group_by(country=factor(country)) %>%
  na.omit() %>%
  summarise(goal_count=sum(goals)) %>%
ggplot(.,aes(x=country,y=goal_count,label=goal_count))+geom_col(fill="lightgreen")+
       theme_parksAndRec_light()+geom_text(vjust=-0.5,color=blues9[9],size=5)+
       xlab("Country")+ylab("No of Goals Scored by All Players")+
       ggtitle("No of Goals Scored with Country as in Experience")+
       theme(axis.text.x = element_text(angle = 90,vjust=0))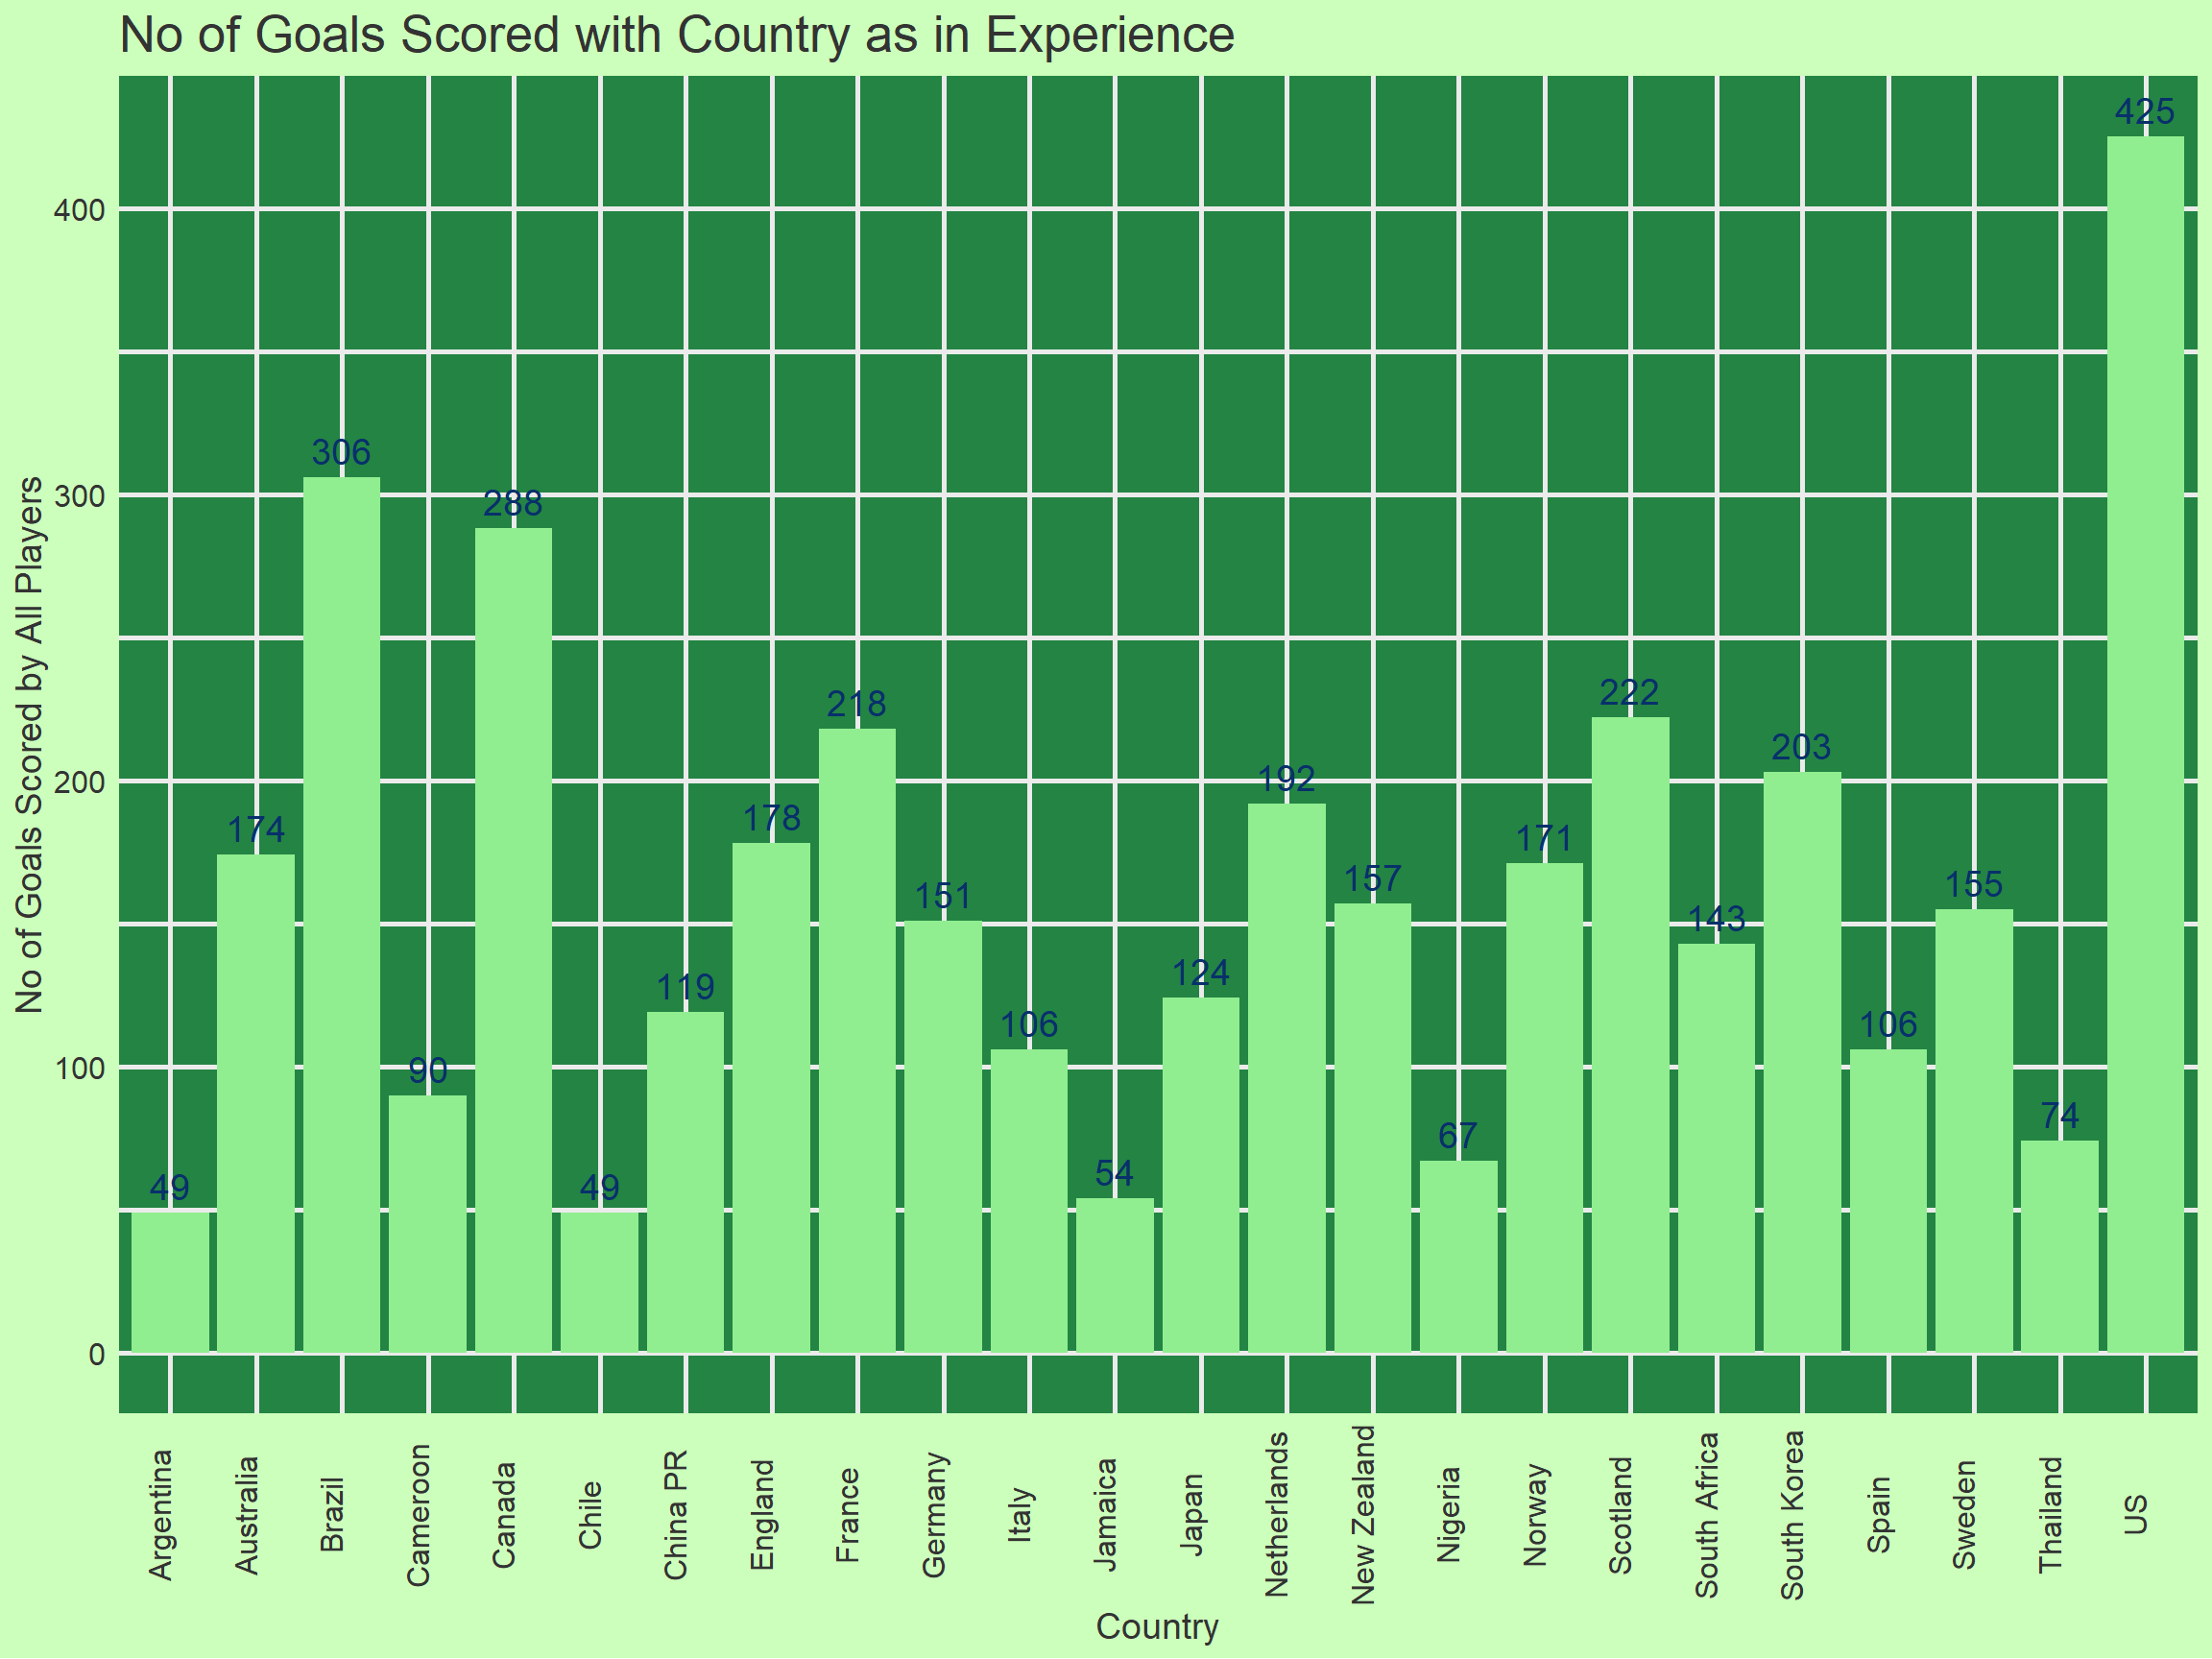
Top 15 Highest Goal Scorers participated in the FIFA World Cup
squads %>%
  top_n(15,goals) %>%
  select(country,player,goals) %>%
ggplot(.,aes(stringr::str_wrap(player,10),goals,fill=country,label=goals))+geom_col()+
       xlab("Player")+ylab("No of Goals")+theme_parksAndRec_light()+
       labs(fill="Country")+geom_text(vjust=-0.5,size=7,color="green")+
       theme(axis.text.x = element_text(angle = 90,vjust=0))+
       ggtitle("Top 15 Players who have played most number of Goals So Far")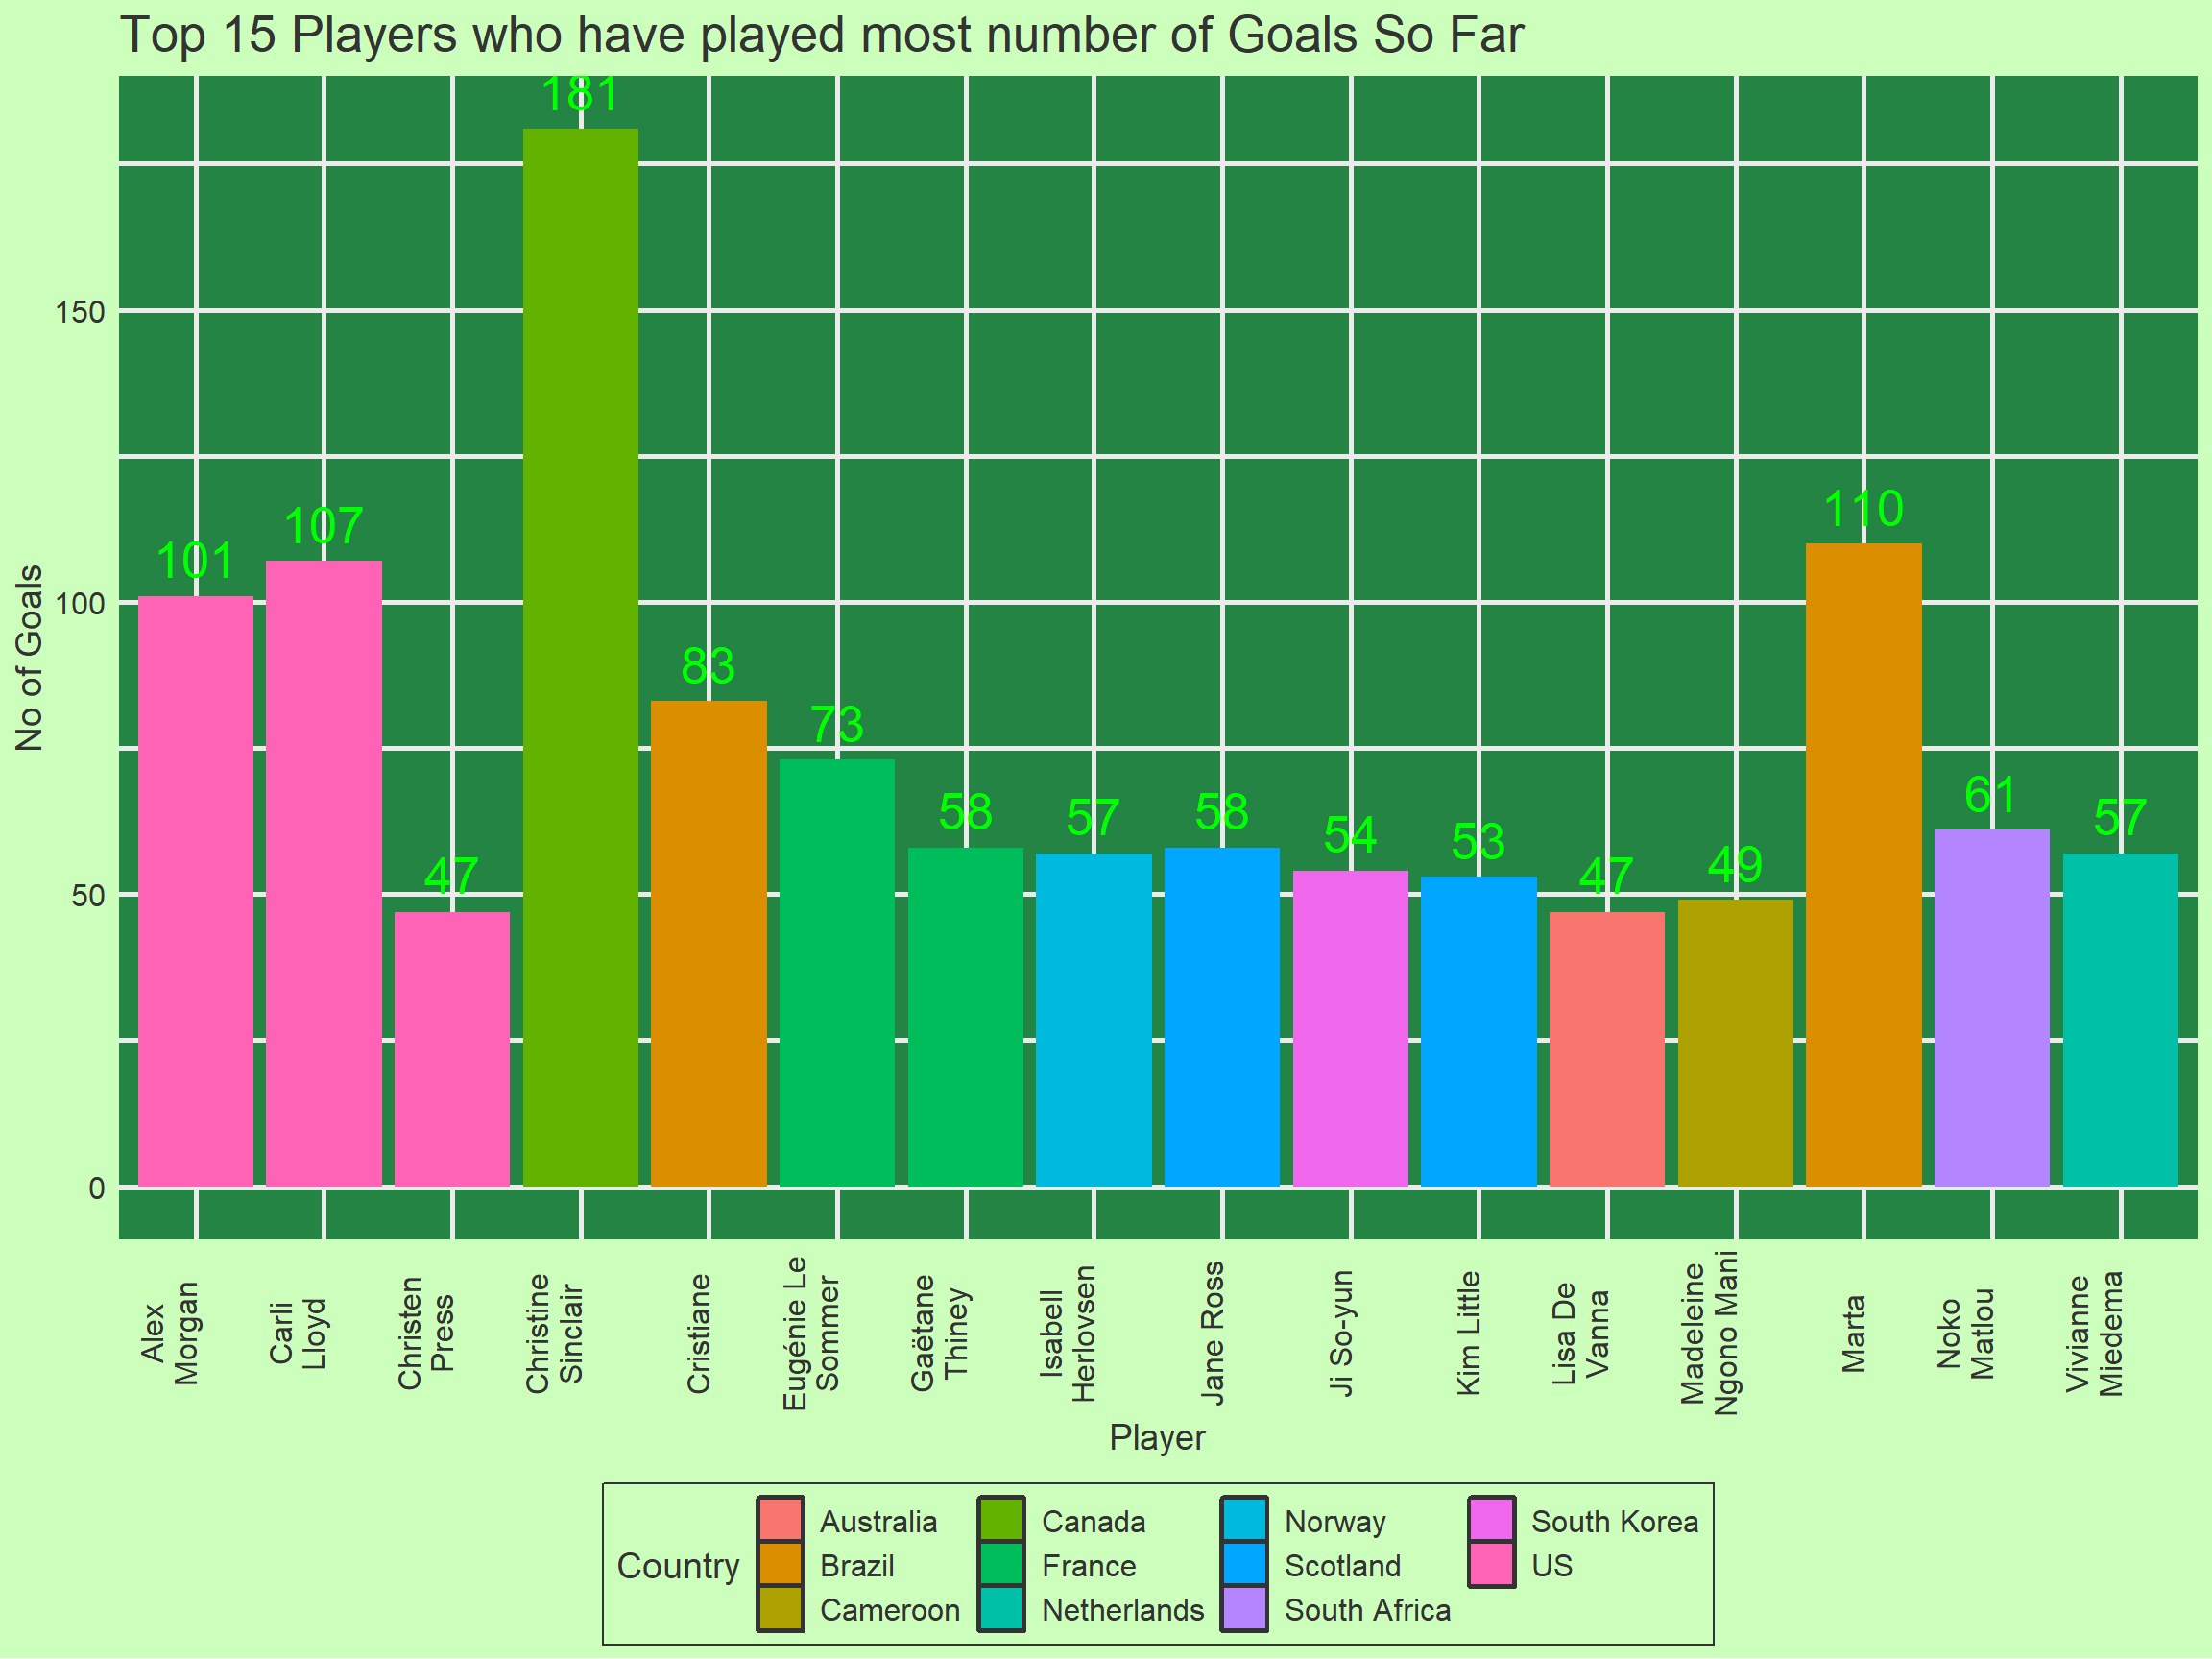
WWC Outcomes
Year vs Countries of participation
wwc_outcomes %>%
  group_by(year,team) %>%
  count(team) %>%
  select(year,team) %>%
  ungroup() %>%
  count(year) %>%
ggplot(.,aes(factor(year),n,label=n))+geom_col(fill=blues9[5])+
      geom_text(vjust=1,size=9,color=blues9[3])+theme_brooklyn99()+
      xlab("Year")+ylab("No of Countries Participated")+
      ggtitle("No of Countries participated by Year")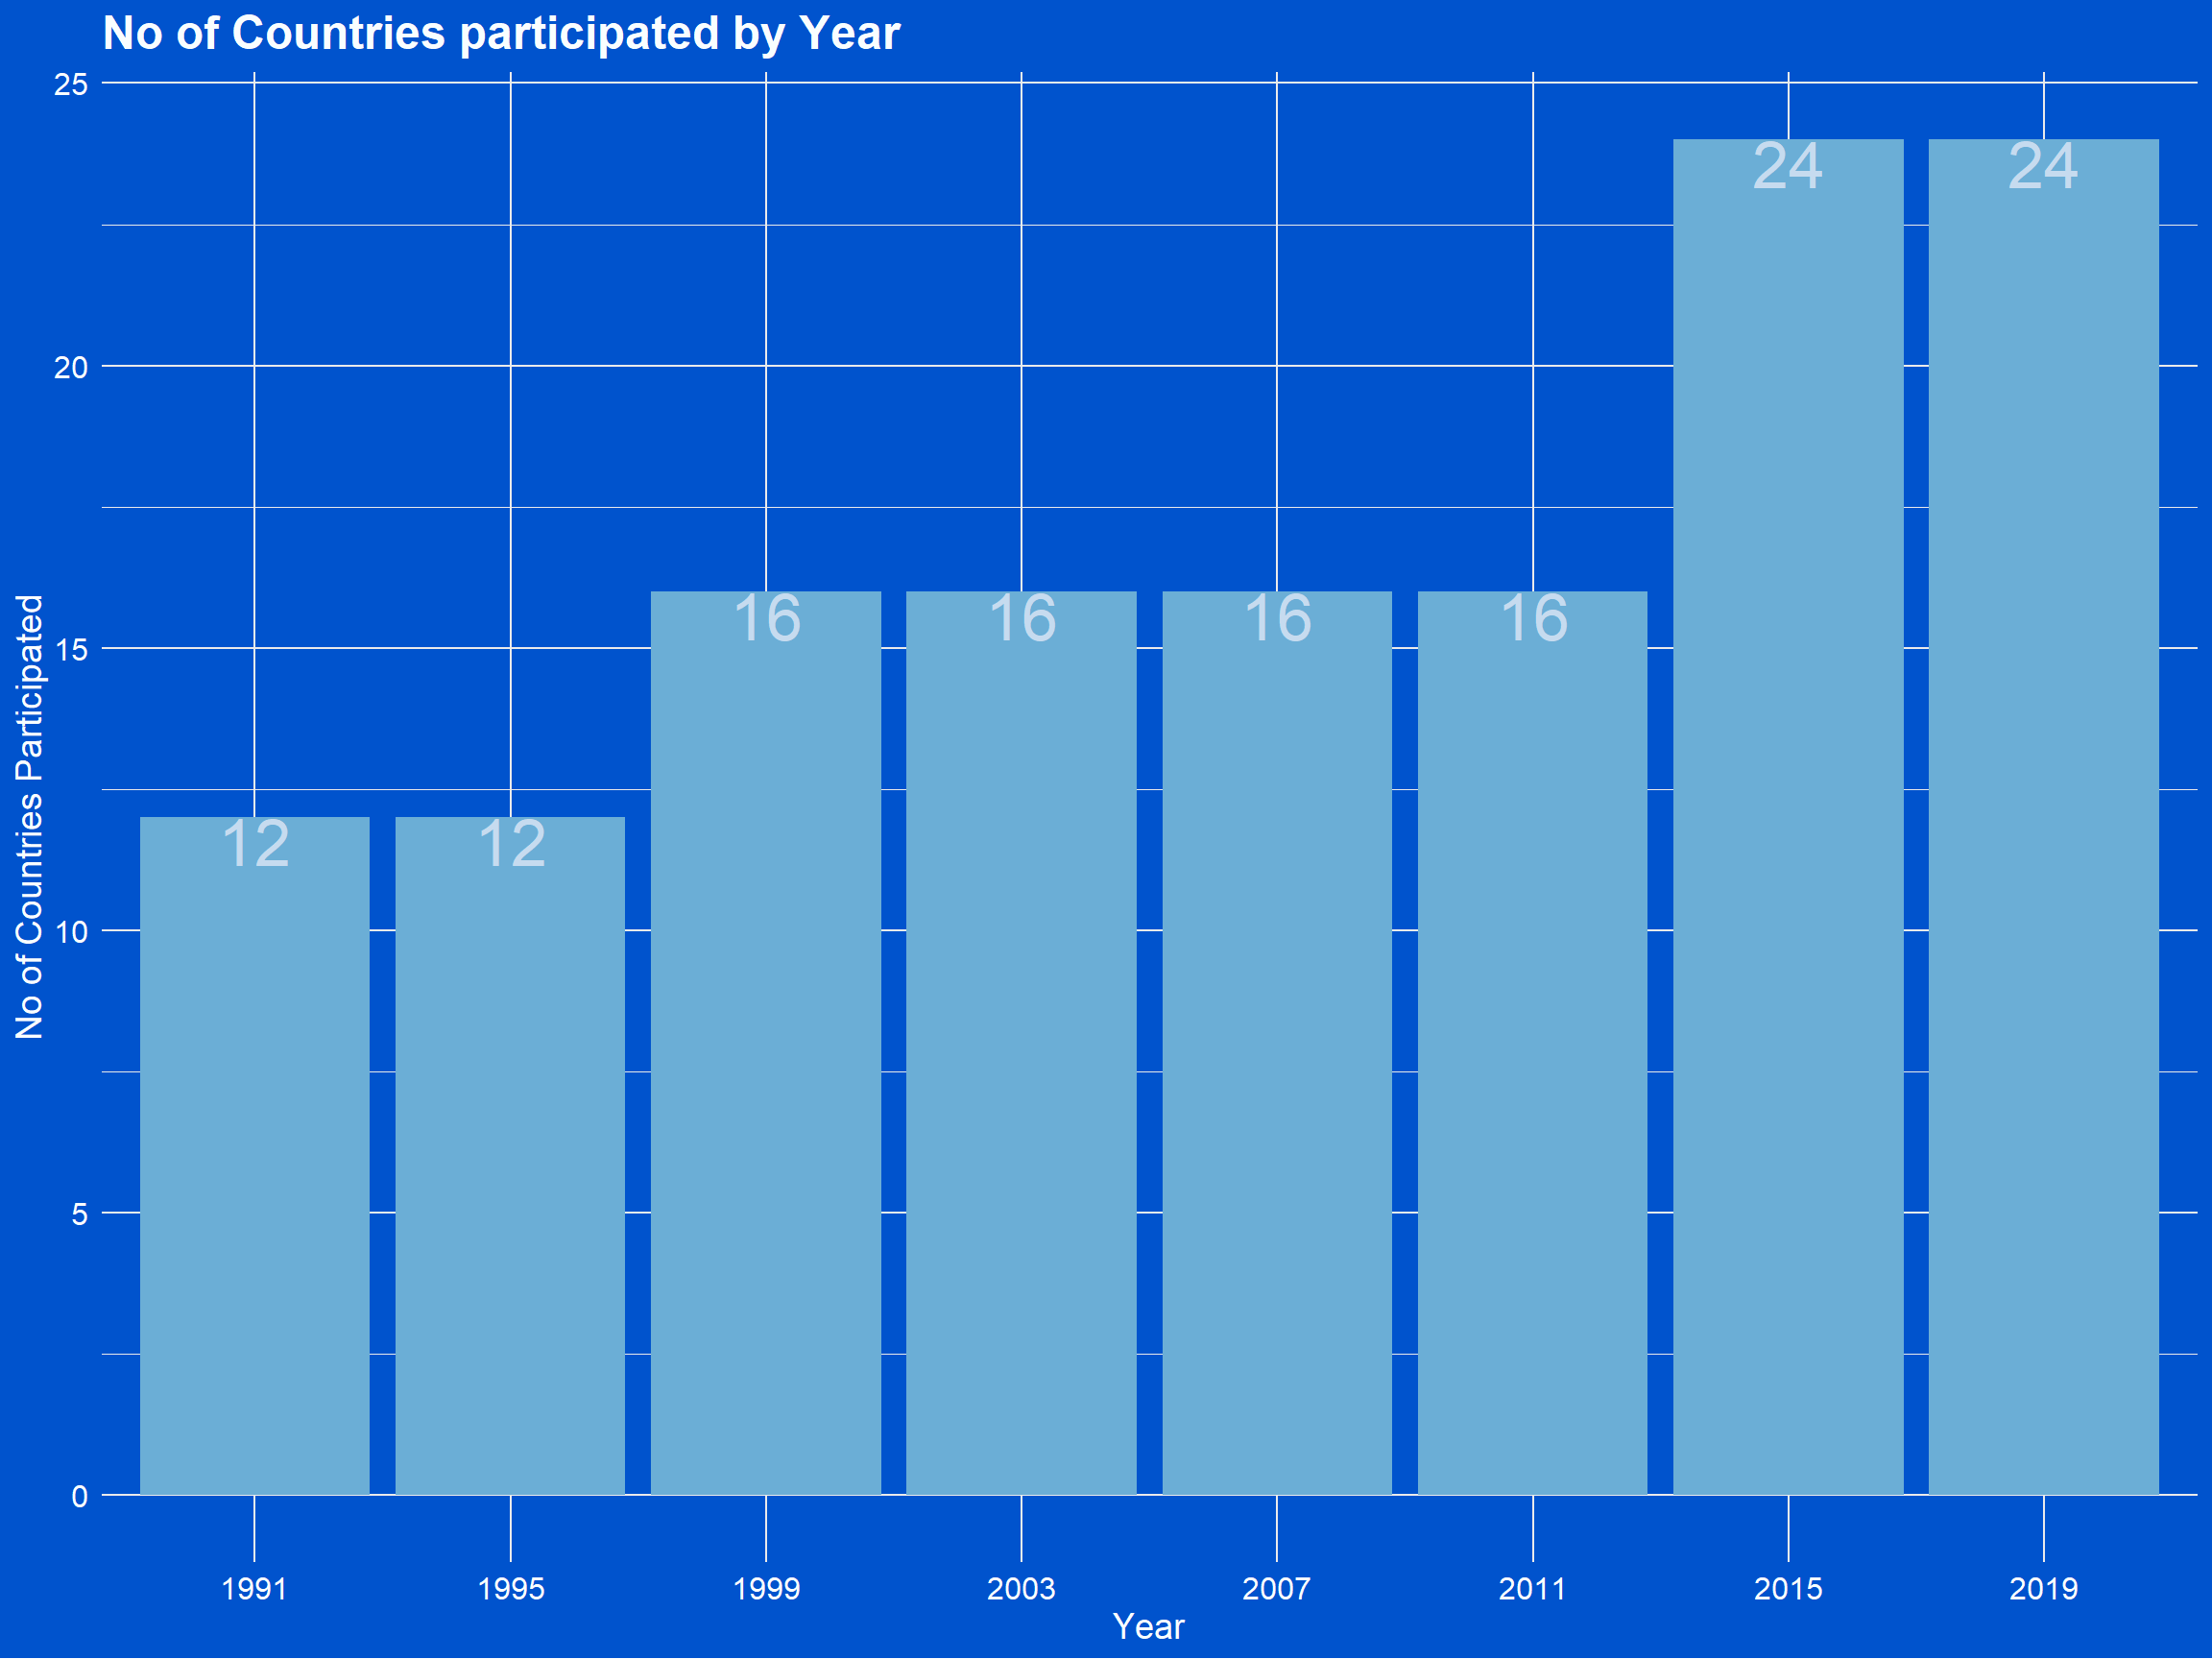
wwc_outcomes %>%
  group_by(year,team) %>%
  count(team) %>%
ggplot(.,aes(stringr::str_wrap(team,12),n,label=n))+
      geom_col(fill=blues9[5])+
      geom_text(vjust=1,size=6,color=blues9[3])+theme_brooklyn99()+
      xlab("Country")+ylab("No of Matches")+
      transition_states(year)+ease_aes("linear")+
      theme(axis.text.x = element_text(angle = 90,vjust=0))+
      ggtitle("No of Matches played by a country changing over the Tournament",
subtitle = "Year:{closest_state}") 
Year vs Rounds of Matches
wwc_outcomes %>%
  group_by(year,round) %>%
  count(round) %>%
  select(year,round) %>%
  ungroup() %>%
  count(year) %>%
ggplot(.,aes(factor(year),n,label=n))+geom_col(fill=blues9[5])+
      geom_text(vjust=1,size=9,color=blues9[3])+theme_brooklyn99()+
      xlab("Year")+ylab("No of Rounds in the Tournament")+
ggtitle("No of Rounds by Year") 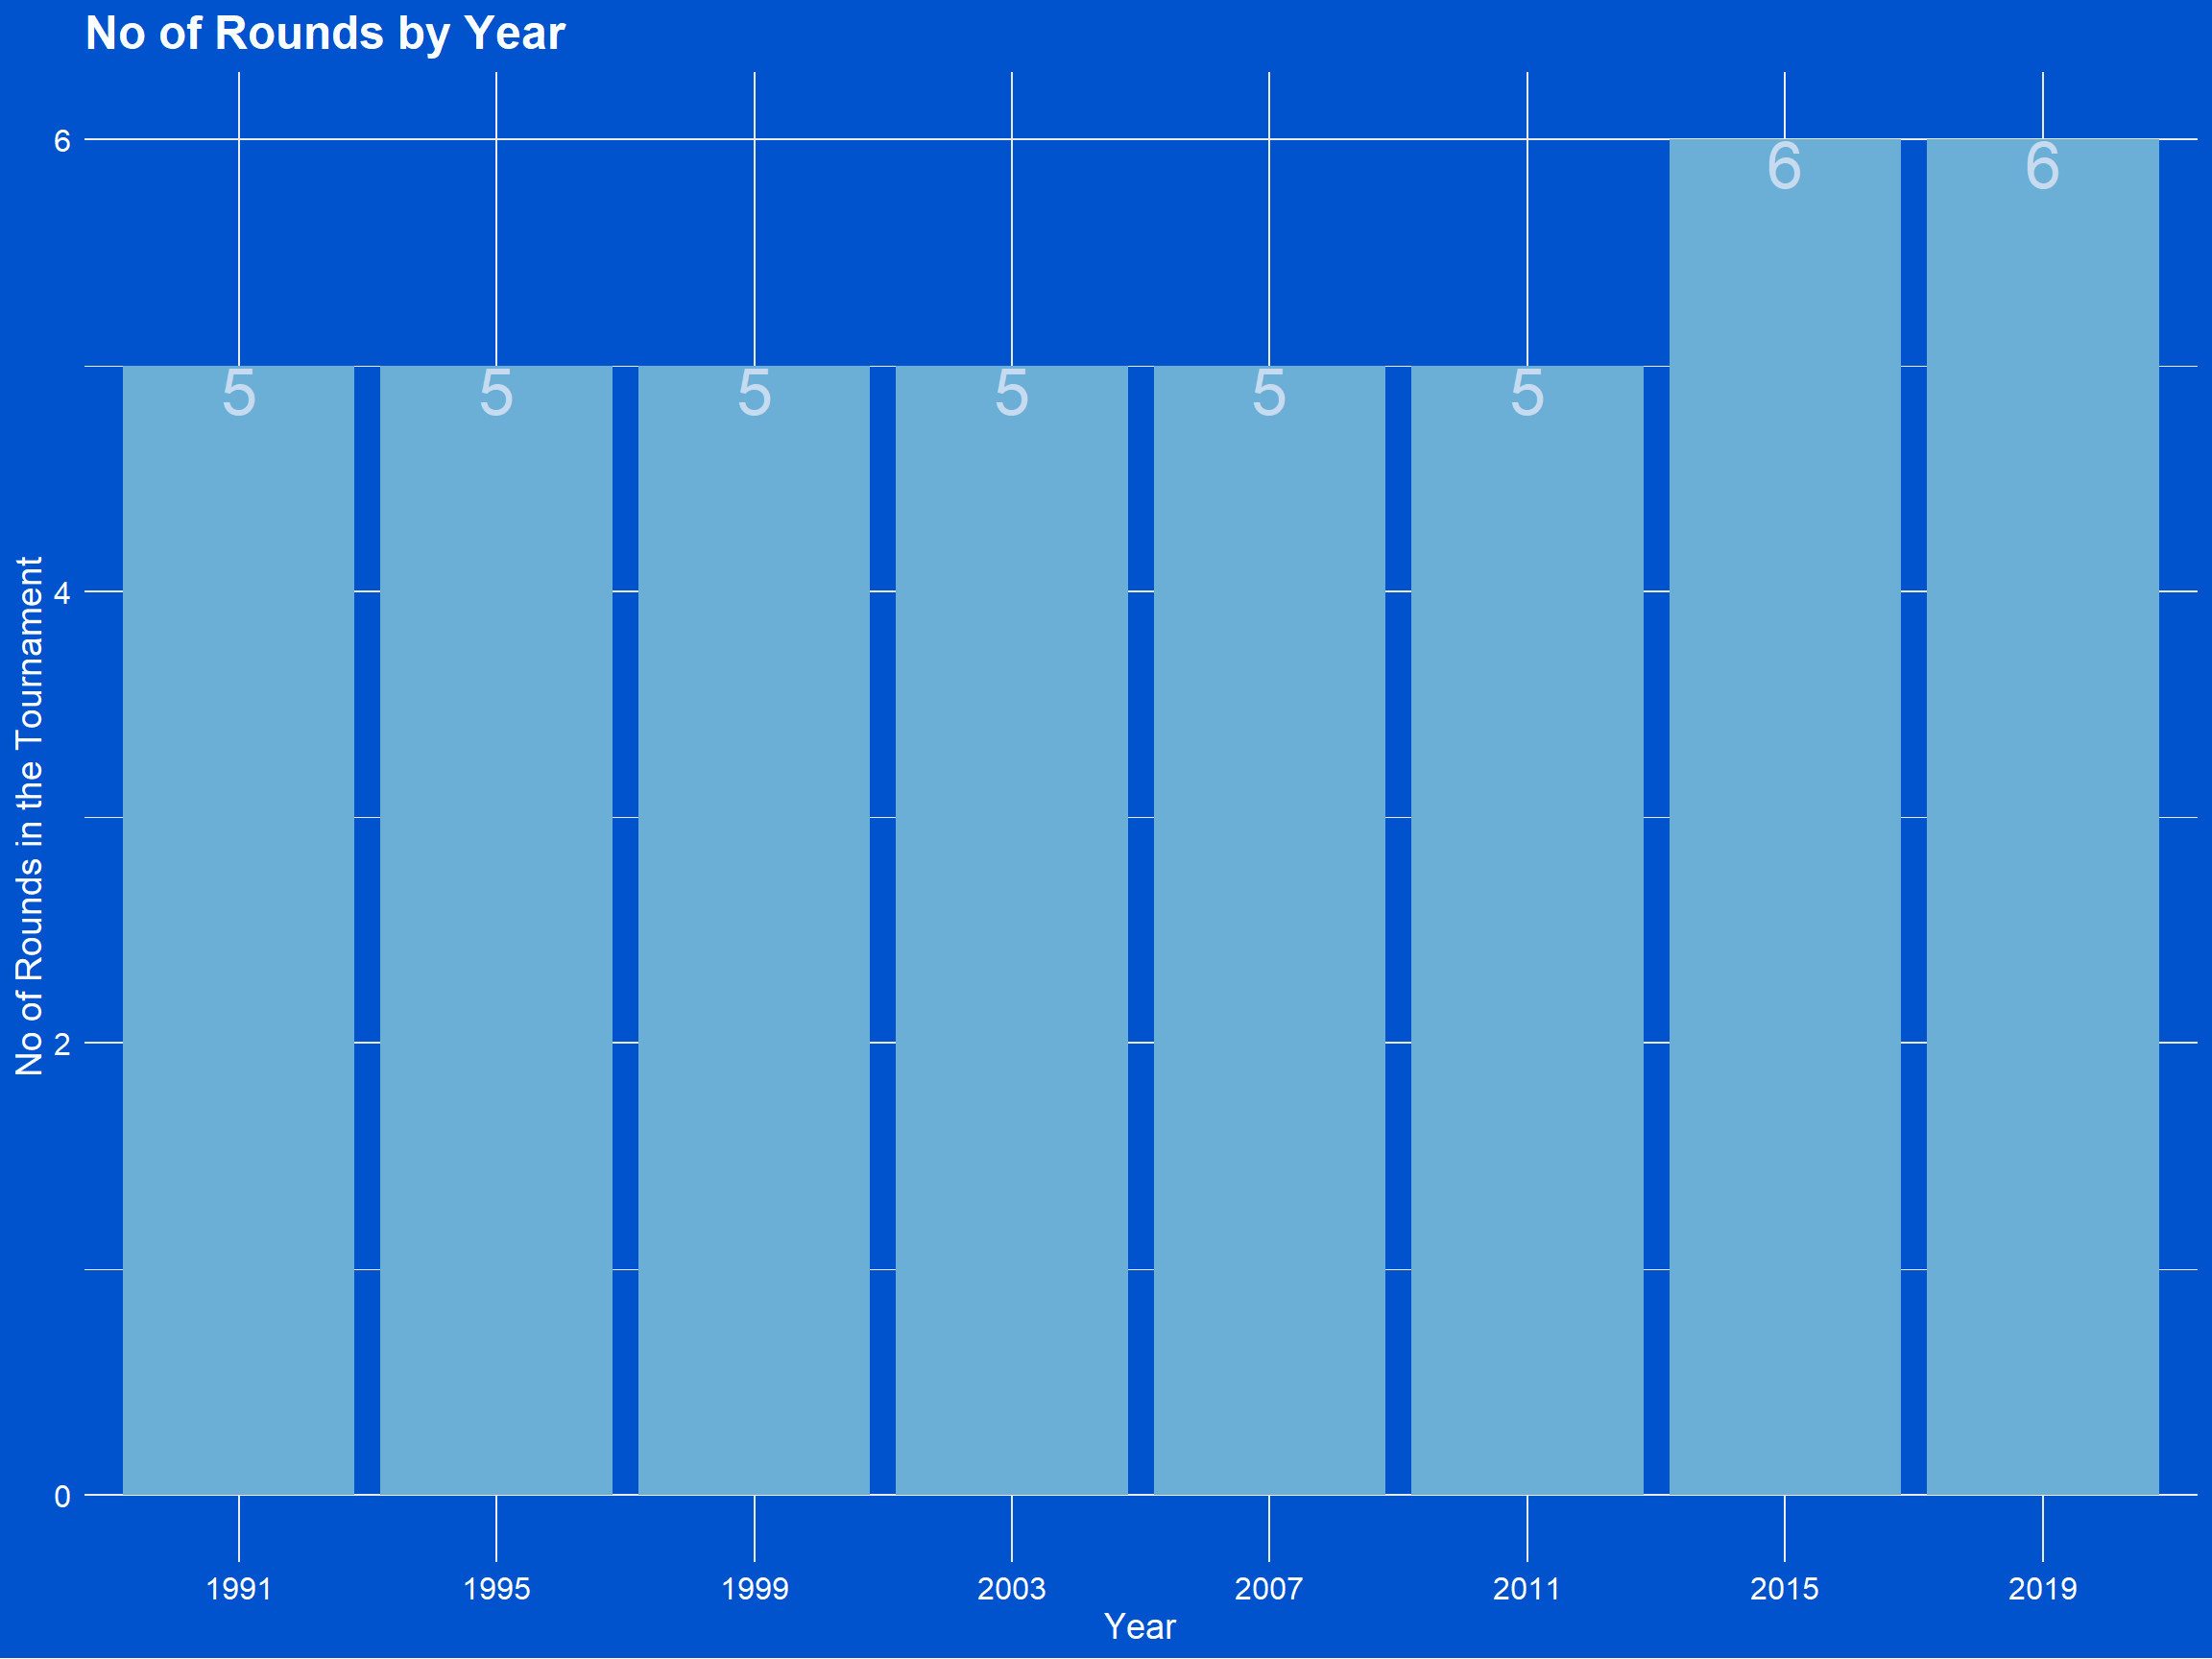
wwc_outcomes %>%
  group_by(year,round) %>%
  count(round) %>%
  mutate(matches=n/2) %>%
ggplot(.,aes(stringr::str_wrap(round,12),matches,label=matches))+
      geom_col(fill=blues9[5])+
      geom_text(vjust=1,size=6,color=blues9[3])+theme_brooklyn99()+
      xlab("Rounds of the Tournament")+ylab("No of Matches")+
      transition_states(year)+ease_aes("linear")+
      ggtitle("No of Matches changing over the Tournament",
subtitle = "Year:{closest_state}") 
Years vs Goals
wwc_outcomes %>%
  group_by(year) %>%
  count(score) %>%
ggplot(.,aes(factor(score),n,label=n))+geom_col(fill=blues9[5])+
      geom_text(vjust=1,size=6,color=blues9[3])+theme_brooklyn99()+
      transition_states(year)+ease_aes("linear")+
      xlab("Goals Scored")+ylab("No of Situations")+
      ggtitle("No of Goals Scored by Year with Situations",
subtitle = "Year :{closest_state}") 
THANK YOU