
ufo_sightings <- readr::read_csv("https://raw.githubusercontent.com/rfordatascience/tidytuesday/master/data/2019/2019-06-25/ufo_sightings.csv")

library(tidyverse)
library(gganimate)
library(ggthemes)
library(lubridate)
library(ggforce)
library(ggthemr)USA and Canada has lot of sightings and most of them in mid year. More sightings happen after 6 pm but only until 1 am, which is considered as an overall and for countries USA and Canada as well. #TidyTuesday GitHub code: https://t.co/J4F2wMNQ4B pic.twitter.com/WI4bxBLMVk
— Amalan Mahendran (@Amalan_Con_Stat) June 25, 2019
Timely changes for country and shape
Yearly count changes
ufo_sightings$date_time <- mdy_hm(ufo_sightings$date_time)

ufo_sightings %>%
  mutate(year=year(date_time)) %>%
  count(year) %>%
  ggplot(.,aes(x=as.factor(year),y=n))+geom_col(fill=blues9[4])+
         theme_minimal()+
         theme(axis.text.x = element_text(angle = 90))+
         geom_text(aes(label=n),hjust=-0.1,angle=90,color=blues9[9])+
         xlab("Years")+ylab("Frequency")+
         ggtitle("Yearly count changes")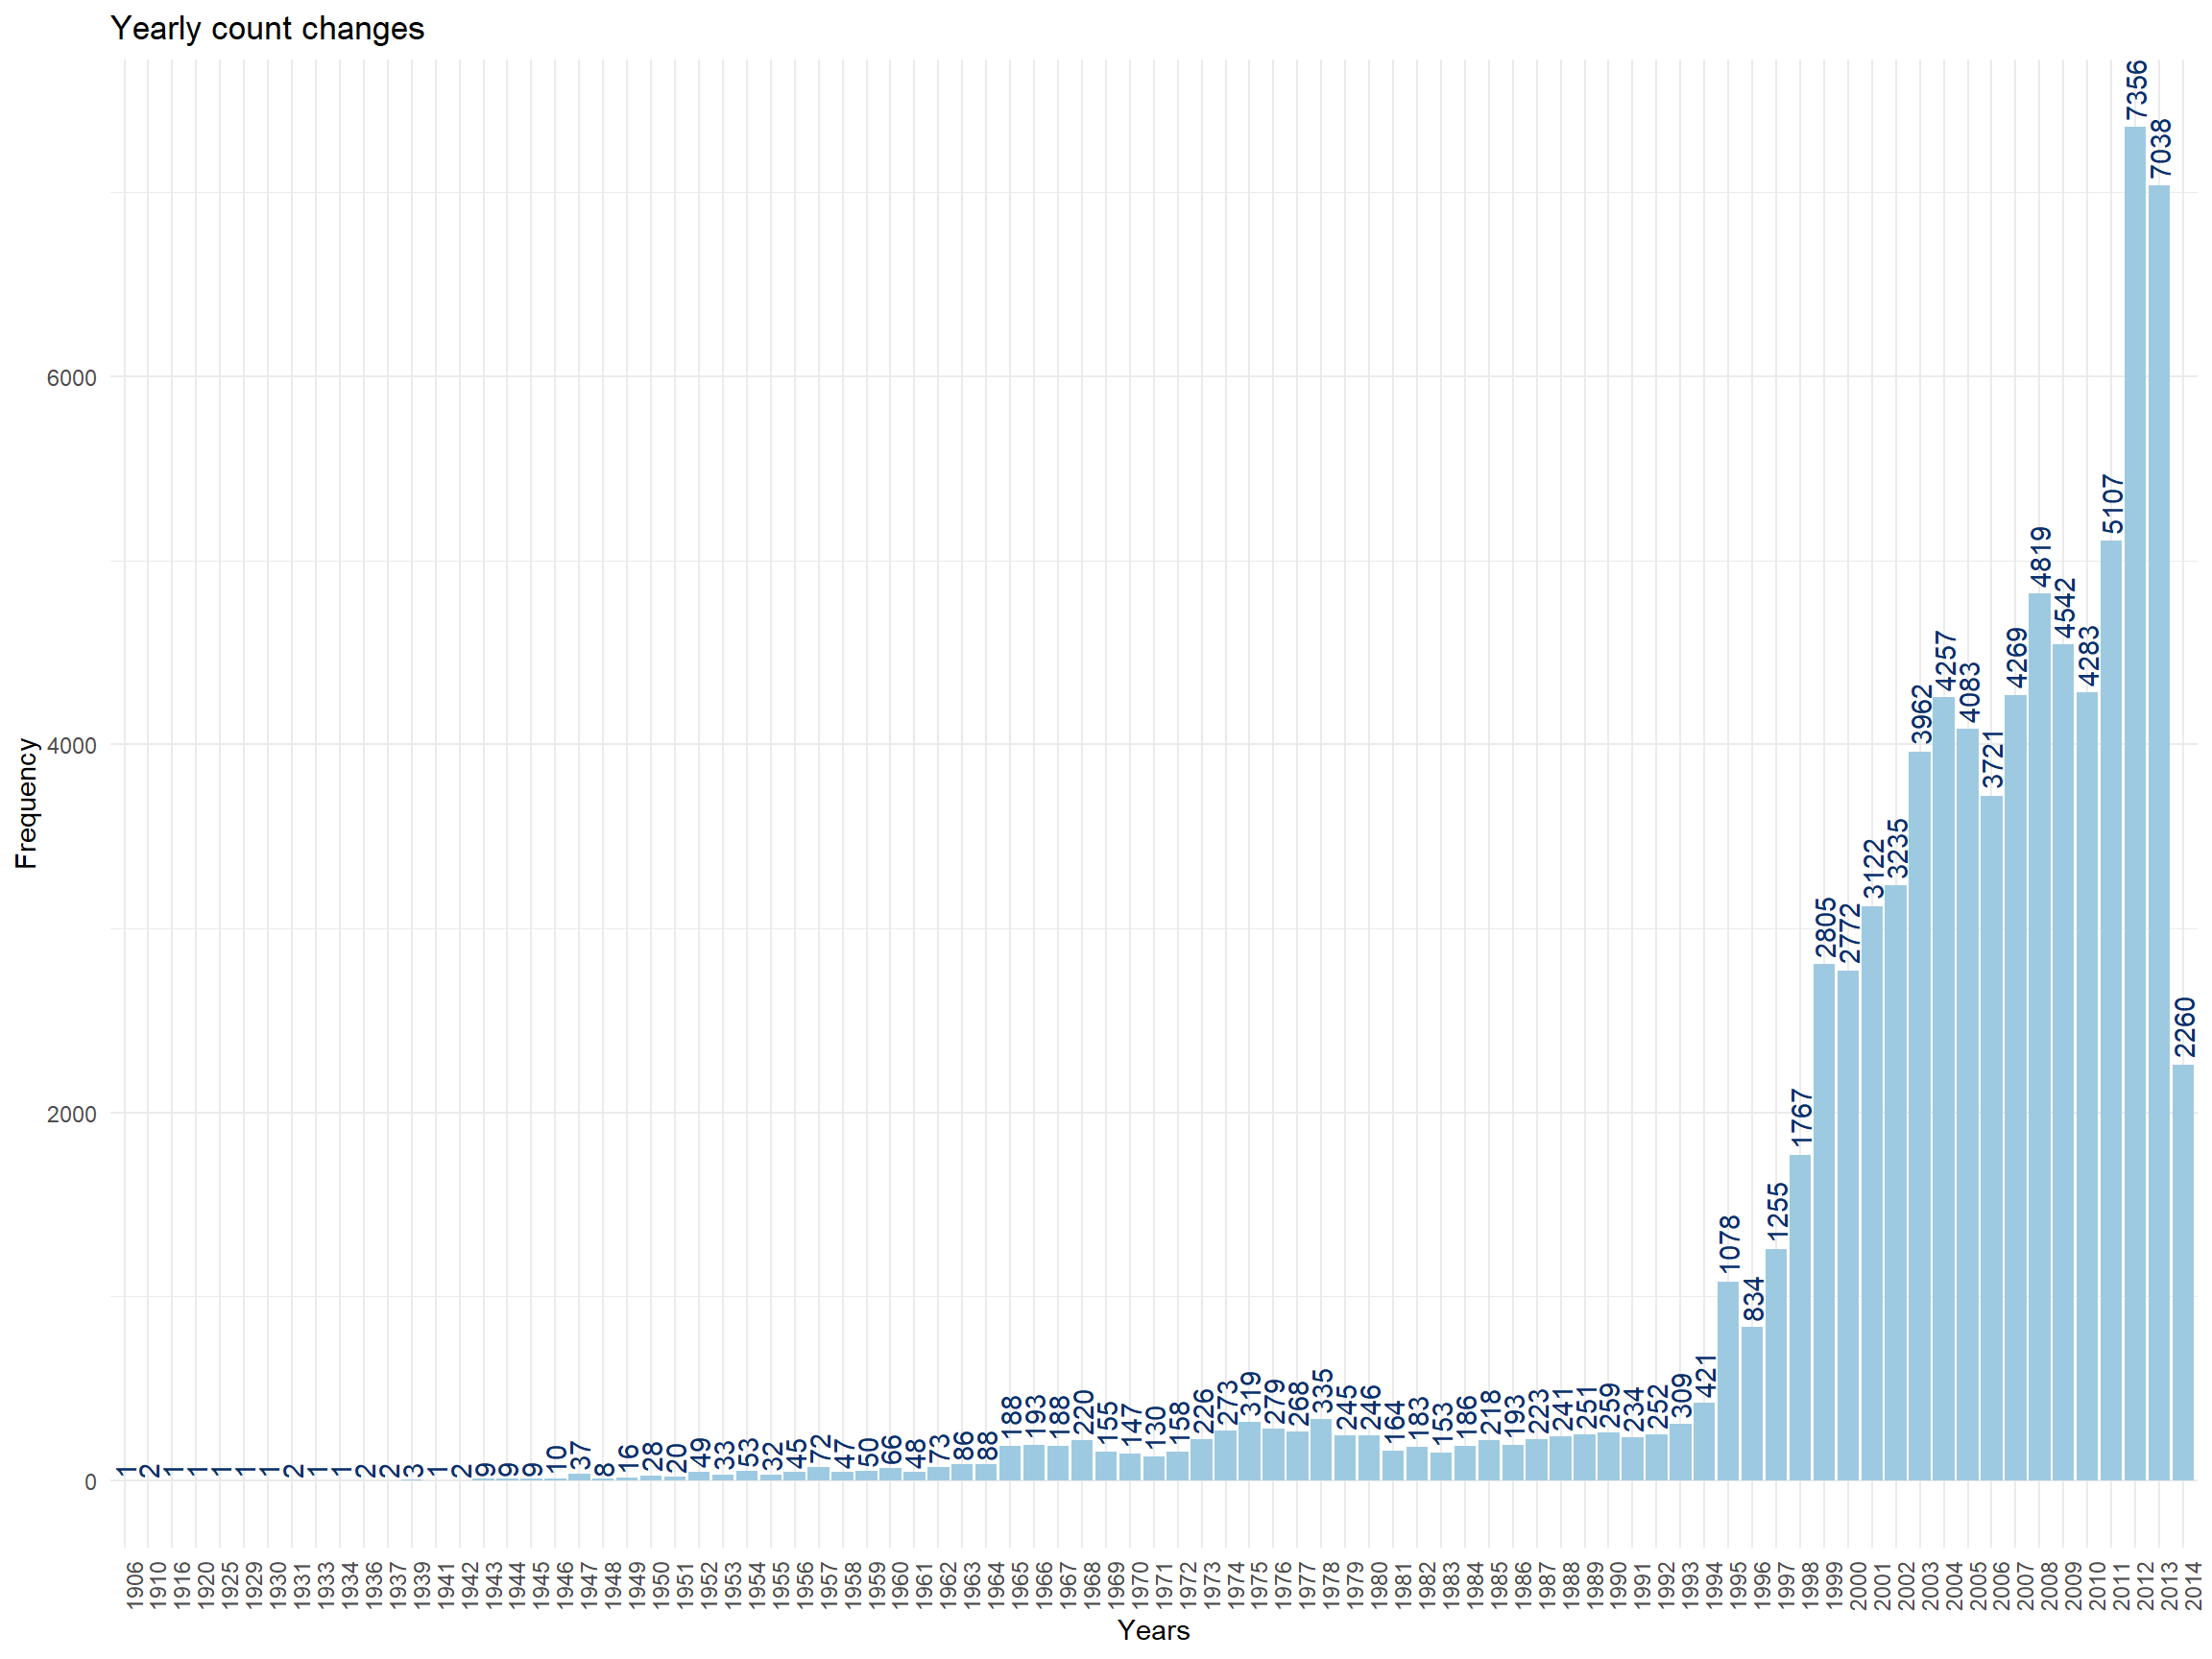
Monthly count changes
ufo_sightings %>%
  mutate(month=month(date_time)) %>%
  count(month) %>%
  ggplot(.,aes(x=as.factor(month),y=n))+geom_col(fill=blues9[4])+
         theme_minimal()+
         geom_text(aes(label=n),vjust=-0.1,color=blues9[9])+
         xlab("Months")+ylab("Frequency")+
         ggtitle("Monthly count changes")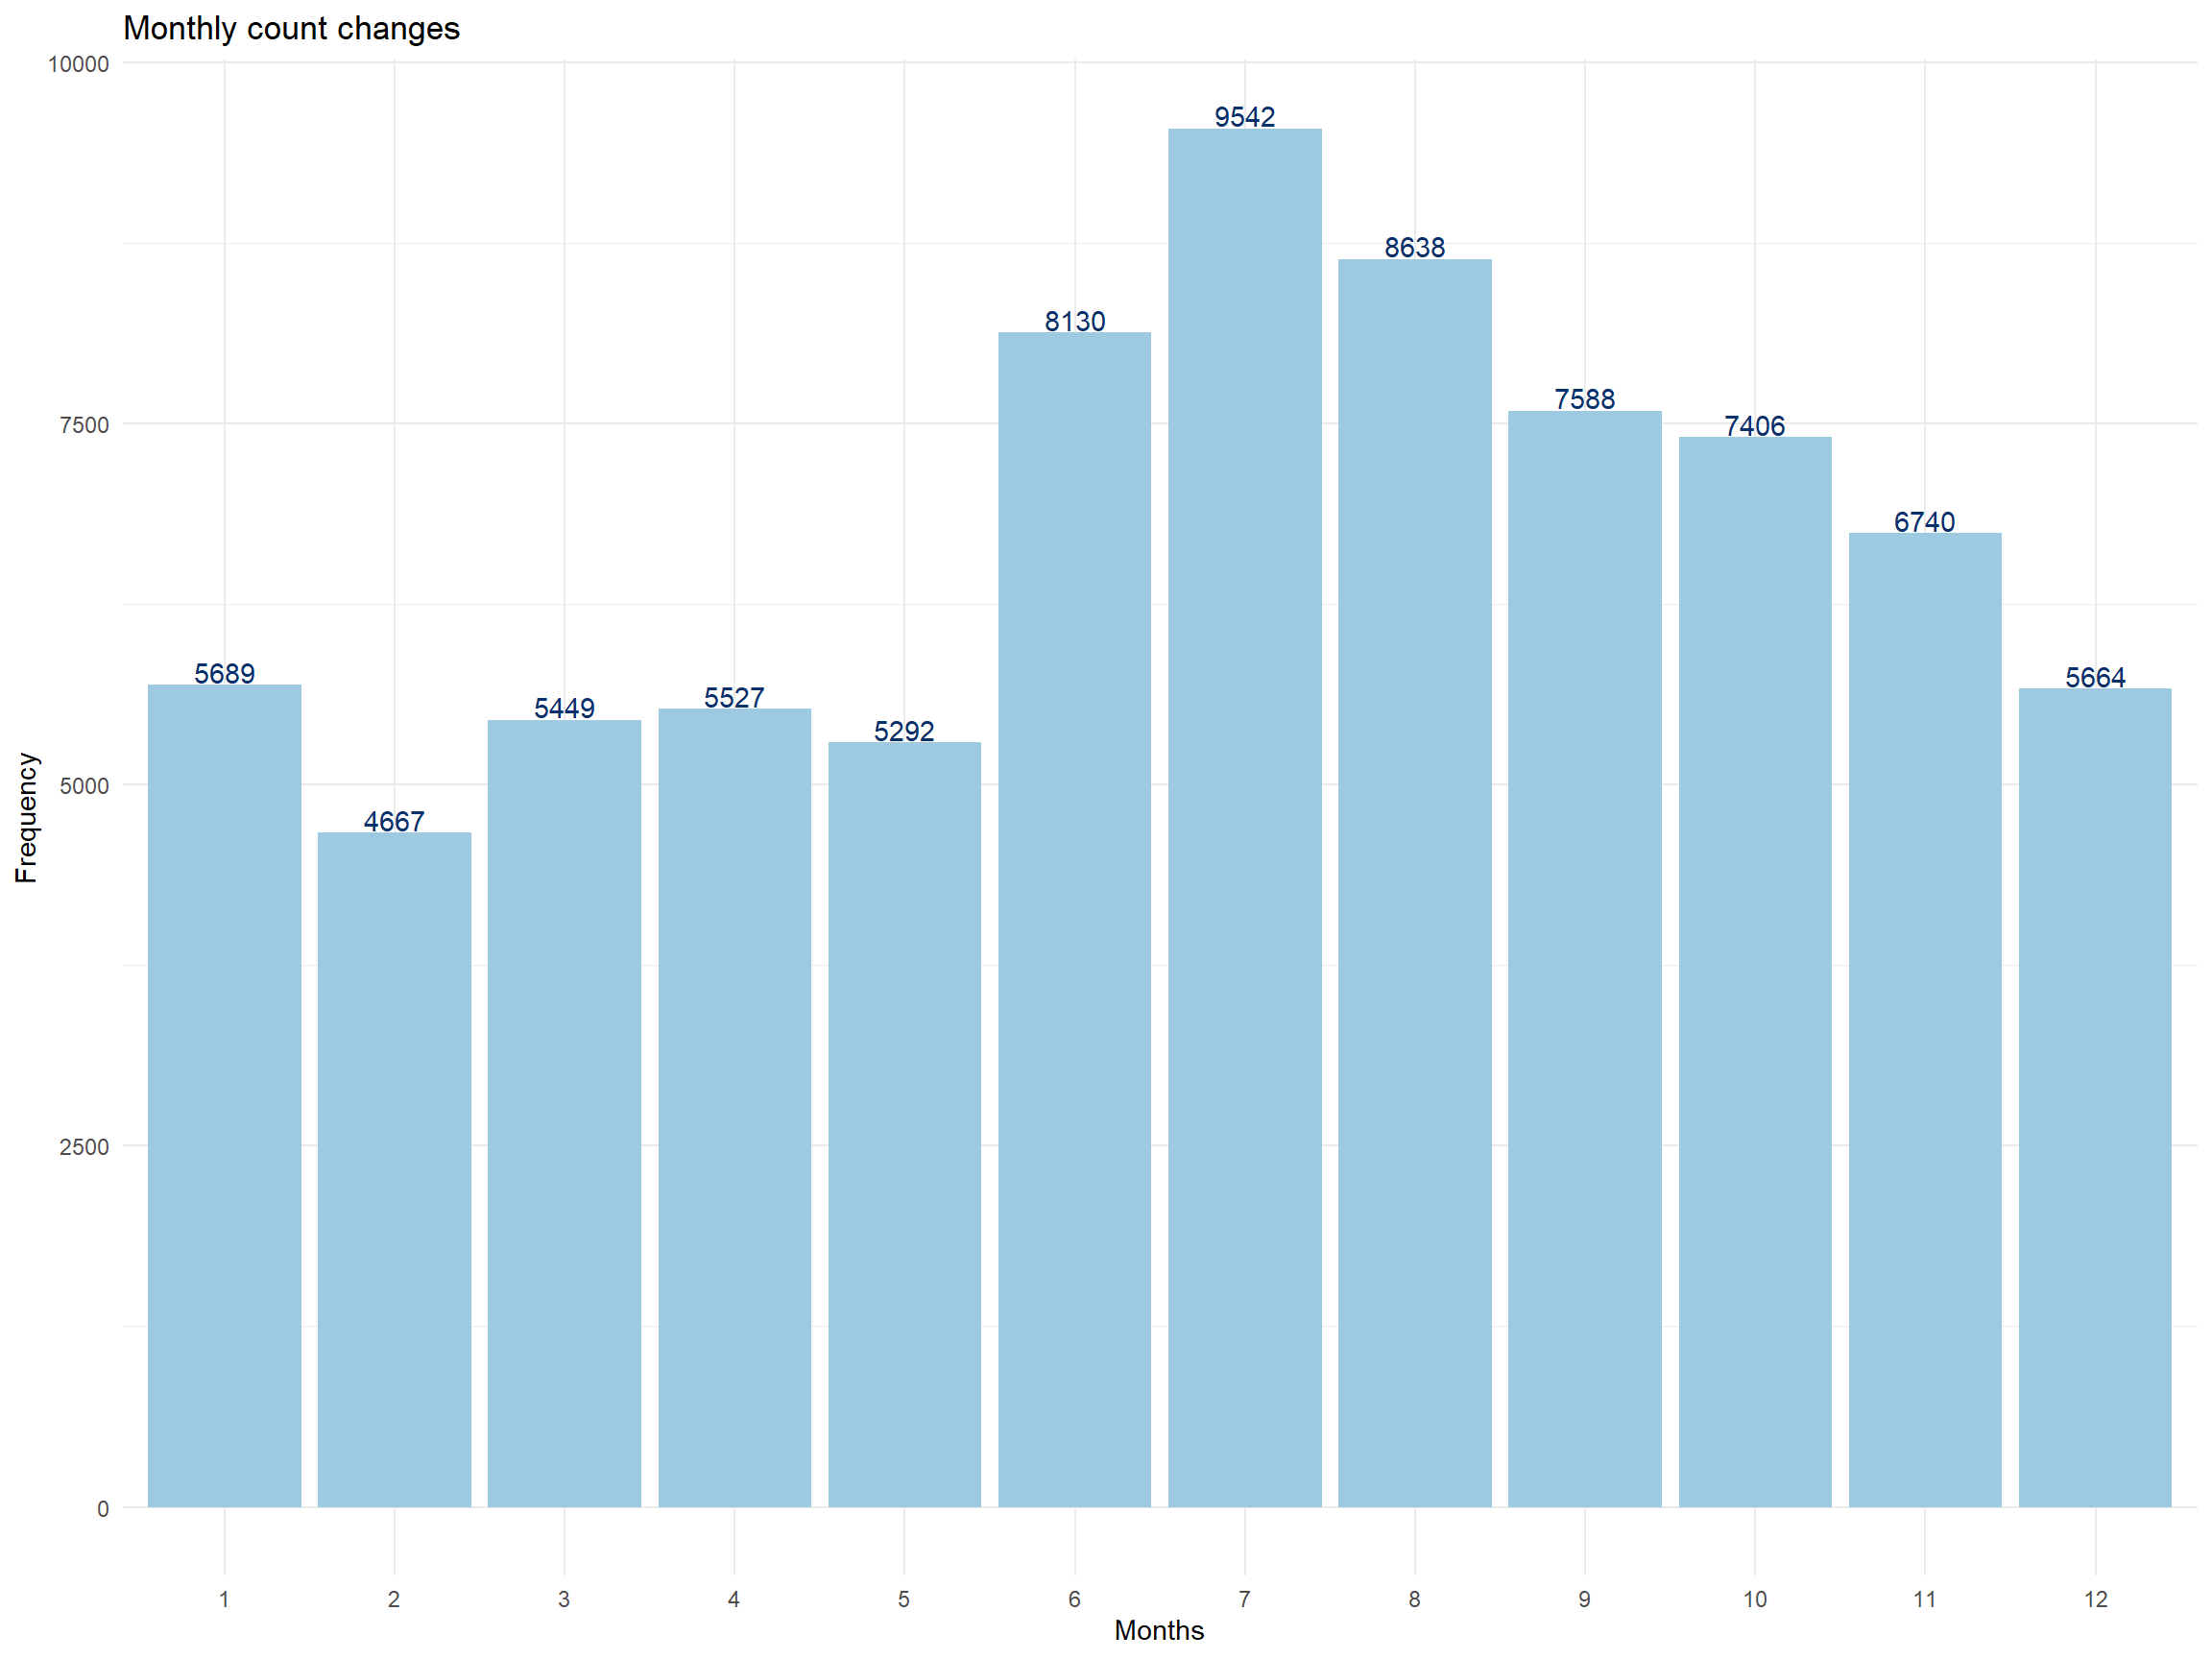
Hourly count changes
ufo_sightings %>%
  mutate(hour=hour(date_time)) %>%
  count(hour) %>%
  ggplot(.,aes(x=as.factor(hour),y=n))+geom_col(fill=blues9[4])+
         theme_minimal()+
         geom_text(aes(label=n),vjust=-0.1,color=blues9[9])+
         xlab("Hours")+ylab("Frequency")+
         ggtitle("Hourly count changes")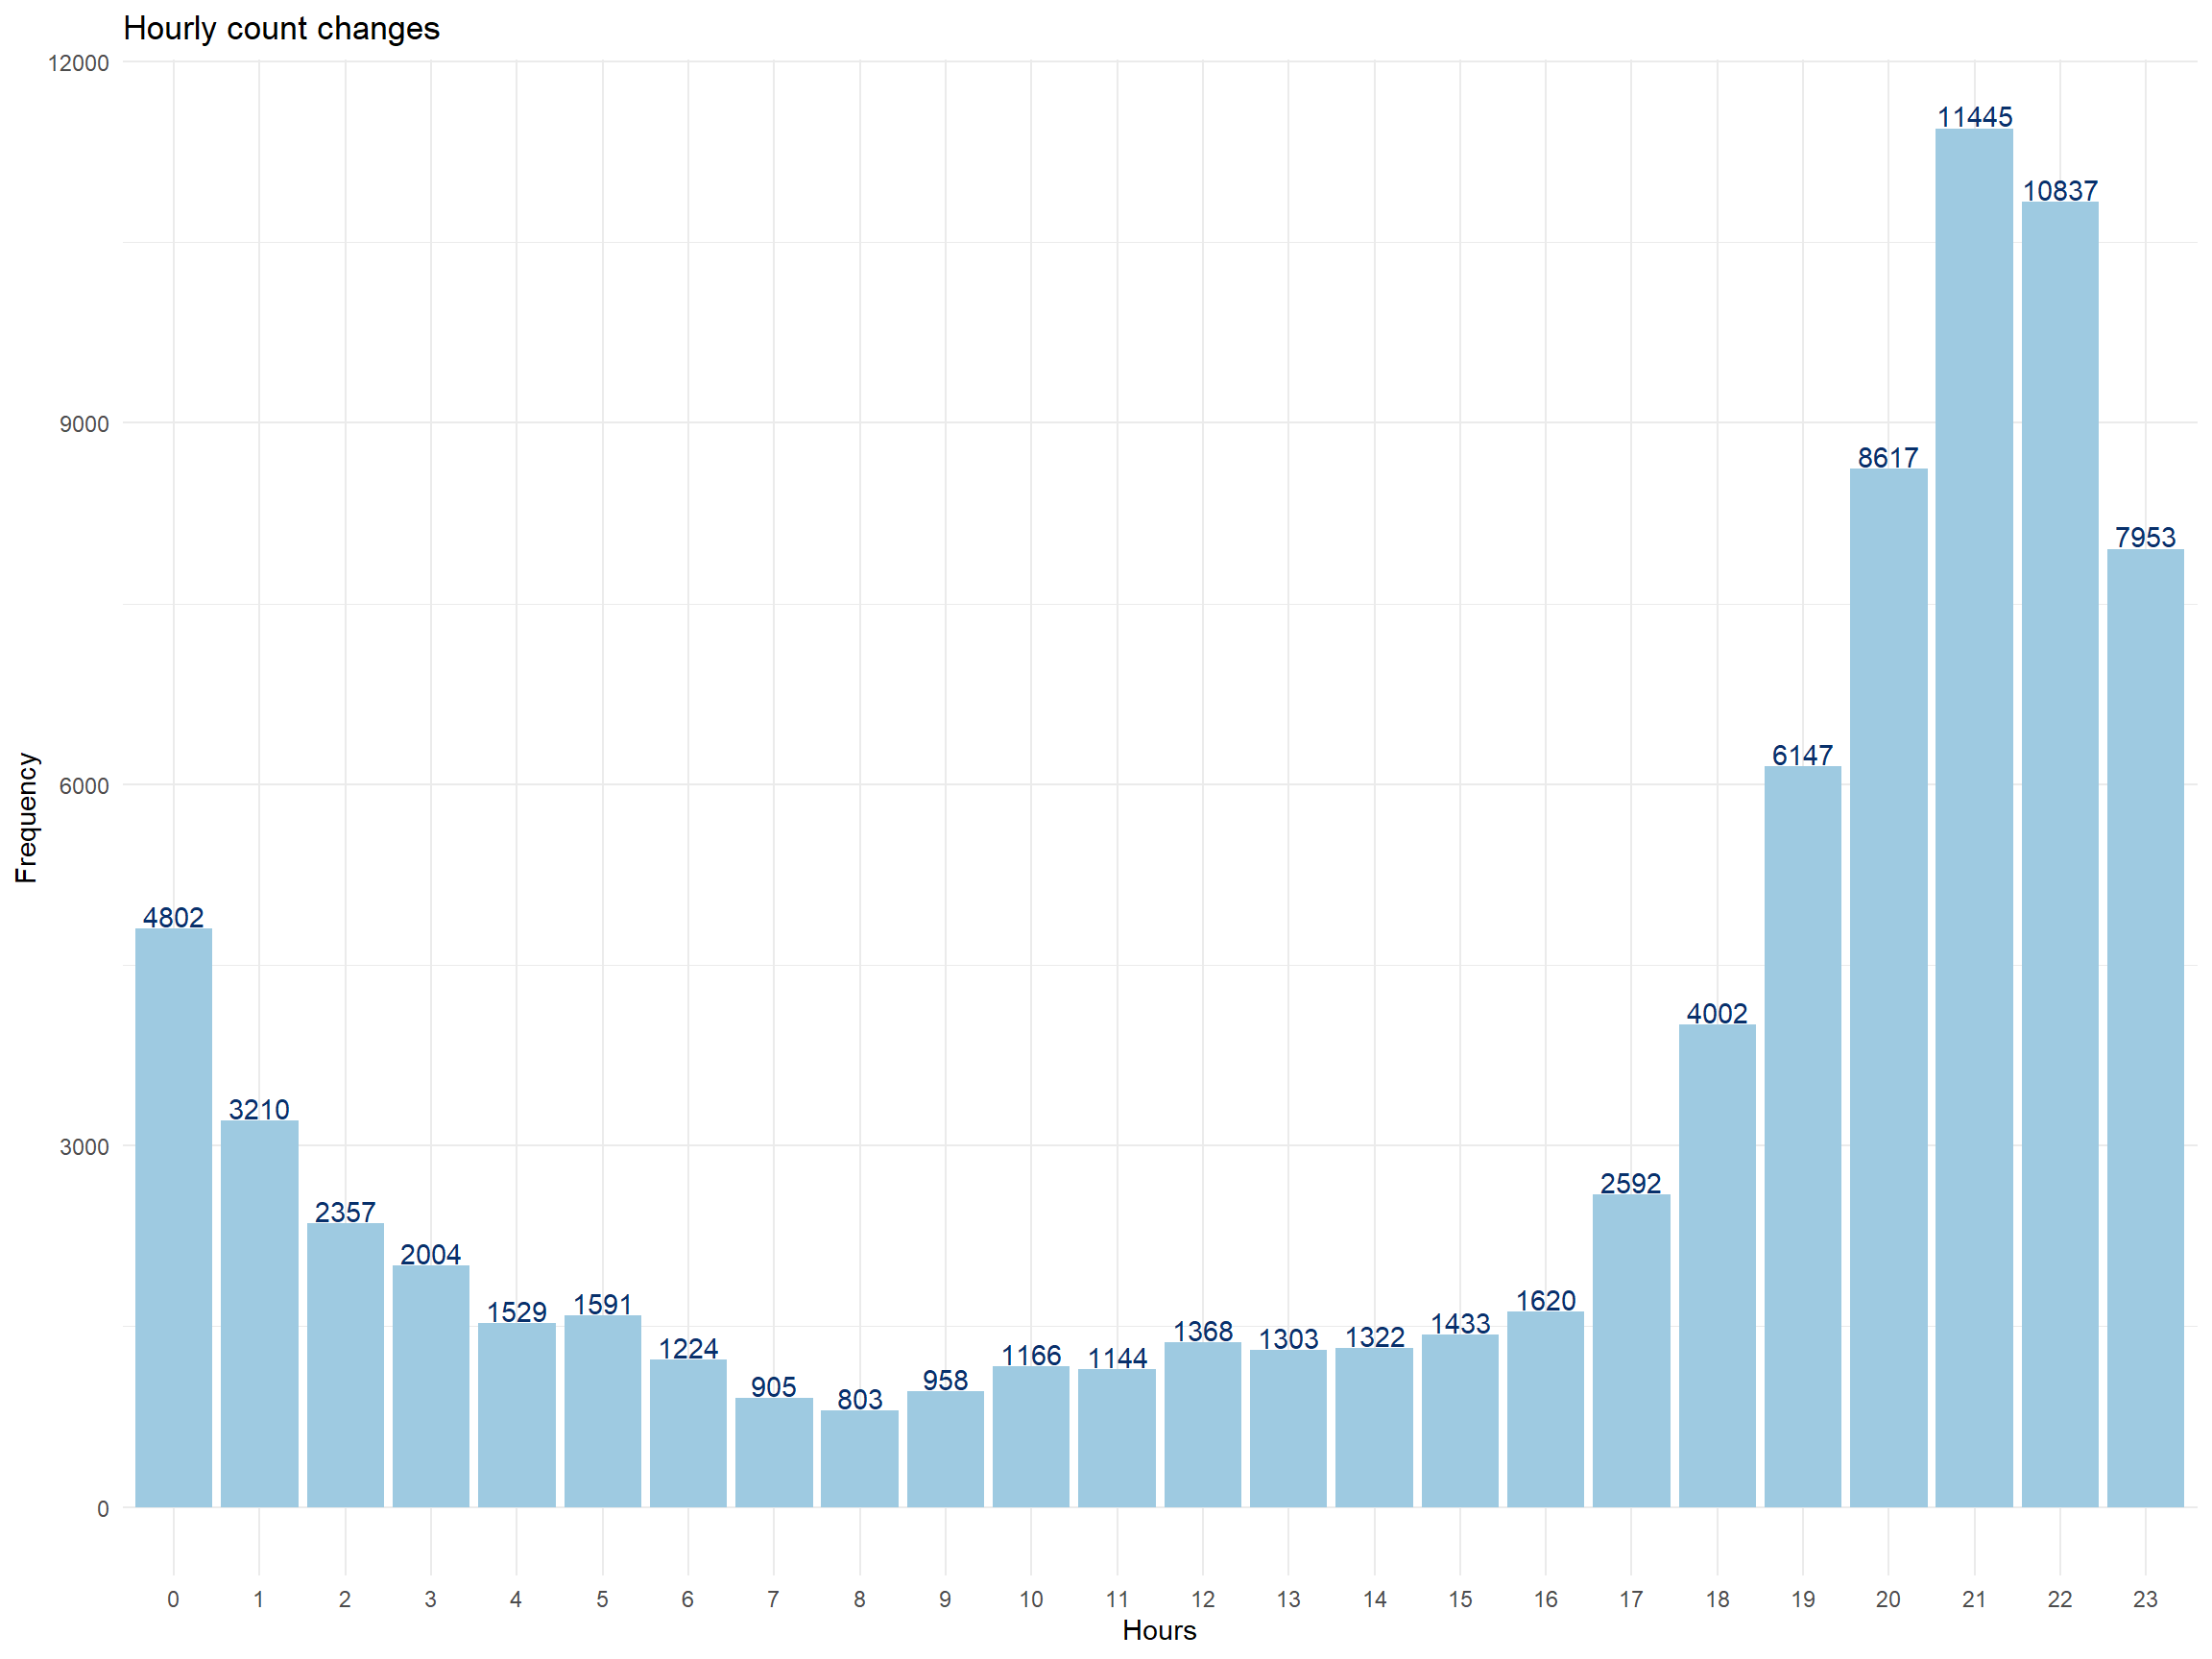
Yearly Count changes for Countries
ufo_sightings %>%
   mutate(year=year(date_time)) %>%
   mutate(country=recode_factor(country,
                                "au"="Australia",
                                "ca"="Canada",
                                "gb"="Great Britain",
                                "us"="USA")) %>%
   group_by(year,country) %>%
   remove_missing() %>%
   count(country) %>%
   ggplot(.,aes(x=as.factor(year),y=n))+geom_col(fill=blues9[8])+
         theme_minimal()+
         facet_wrap(~country,scales = "free_y",ncol = 1)+
         theme(axis.text.x = element_text(angle = 90))+
         xlab("Year")+ylab("Frequency")+
         ggtitle("Yearly count changes for Nations")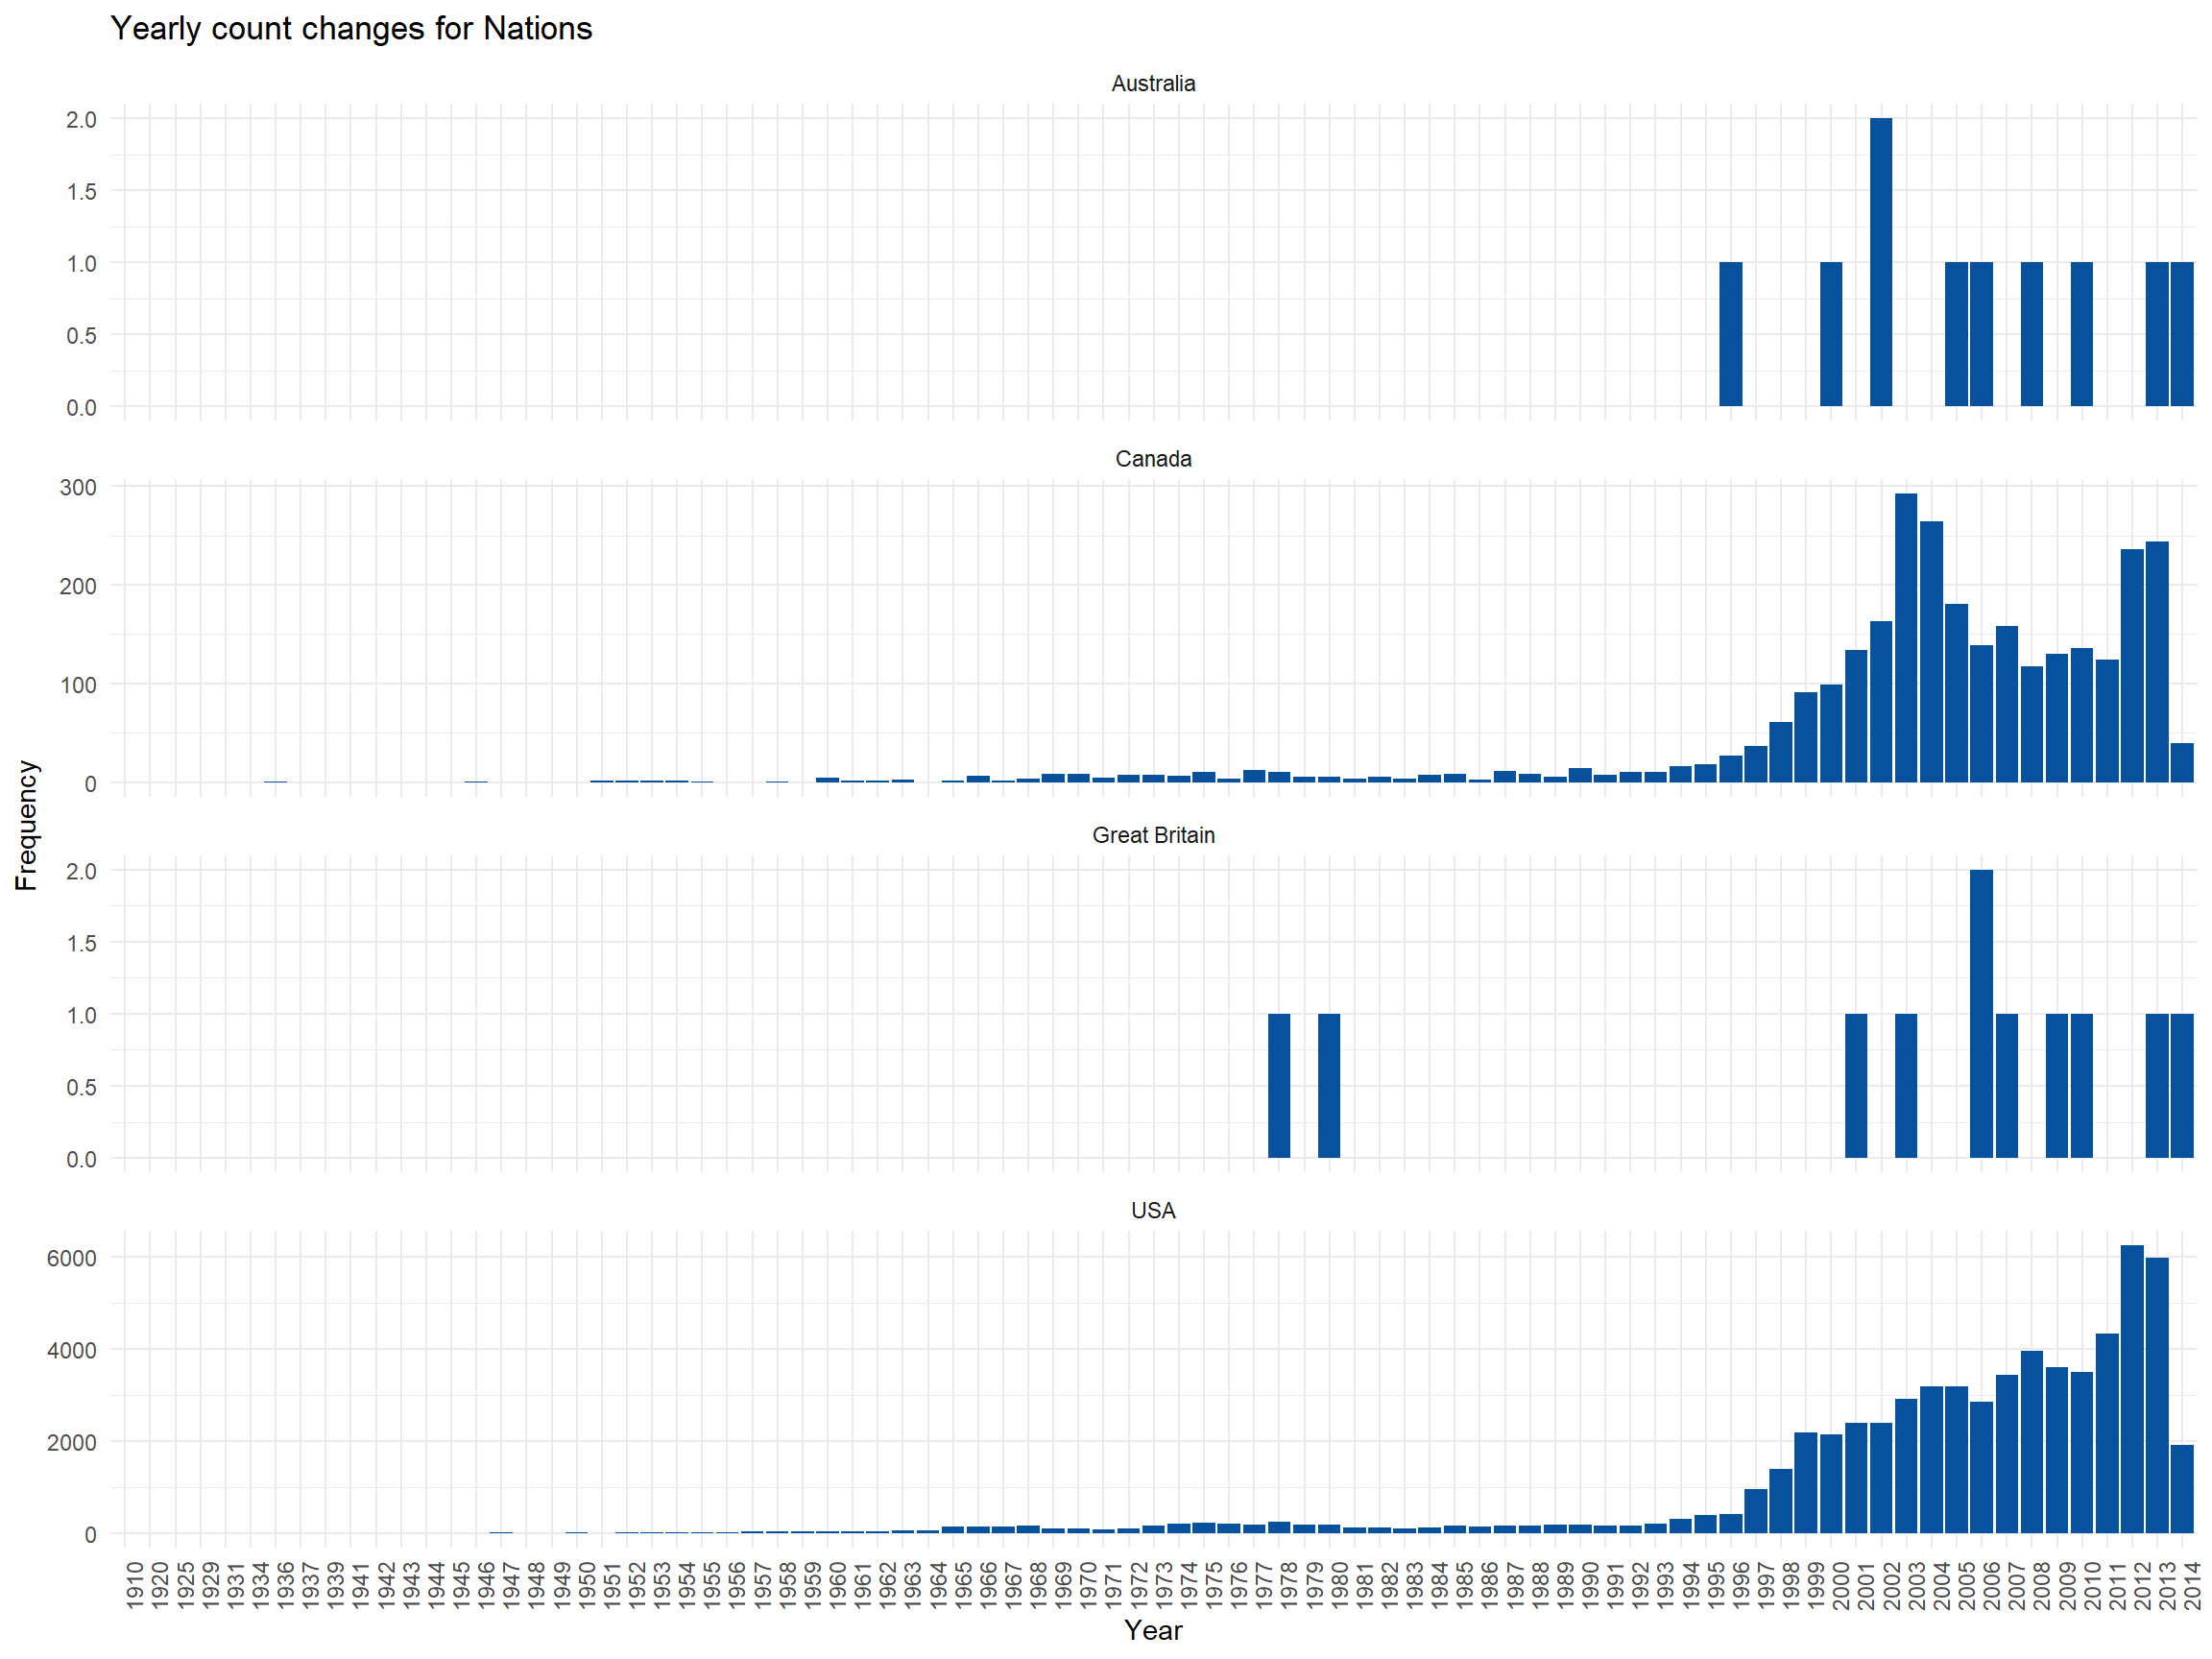
Monthly Count changes for Countries
ufo_sightings %>%
   mutate(month=month(date_time)) %>%
   mutate(country=recode_factor(country,
                                "au"="Australia",
                                "ca"="Canada",
                                "gb"="Great Britain",
                                "us"="USA")) %>%
   group_by(month,country) %>%
   remove_missing() %>%
   count(country) %>%
   ggplot(.,aes(x=as.factor(month),y=n))+geom_col(fill=blues9[8])+
         theme_minimal()+
         facet_wrap(~country,scales = "free_y",ncol = 1)+
         geom_text(aes(label=n),vjust=0.95,color="white")+
         xlab("Months")+ylab("Frequency")+
         ggtitle("Monthly count changes for Nations")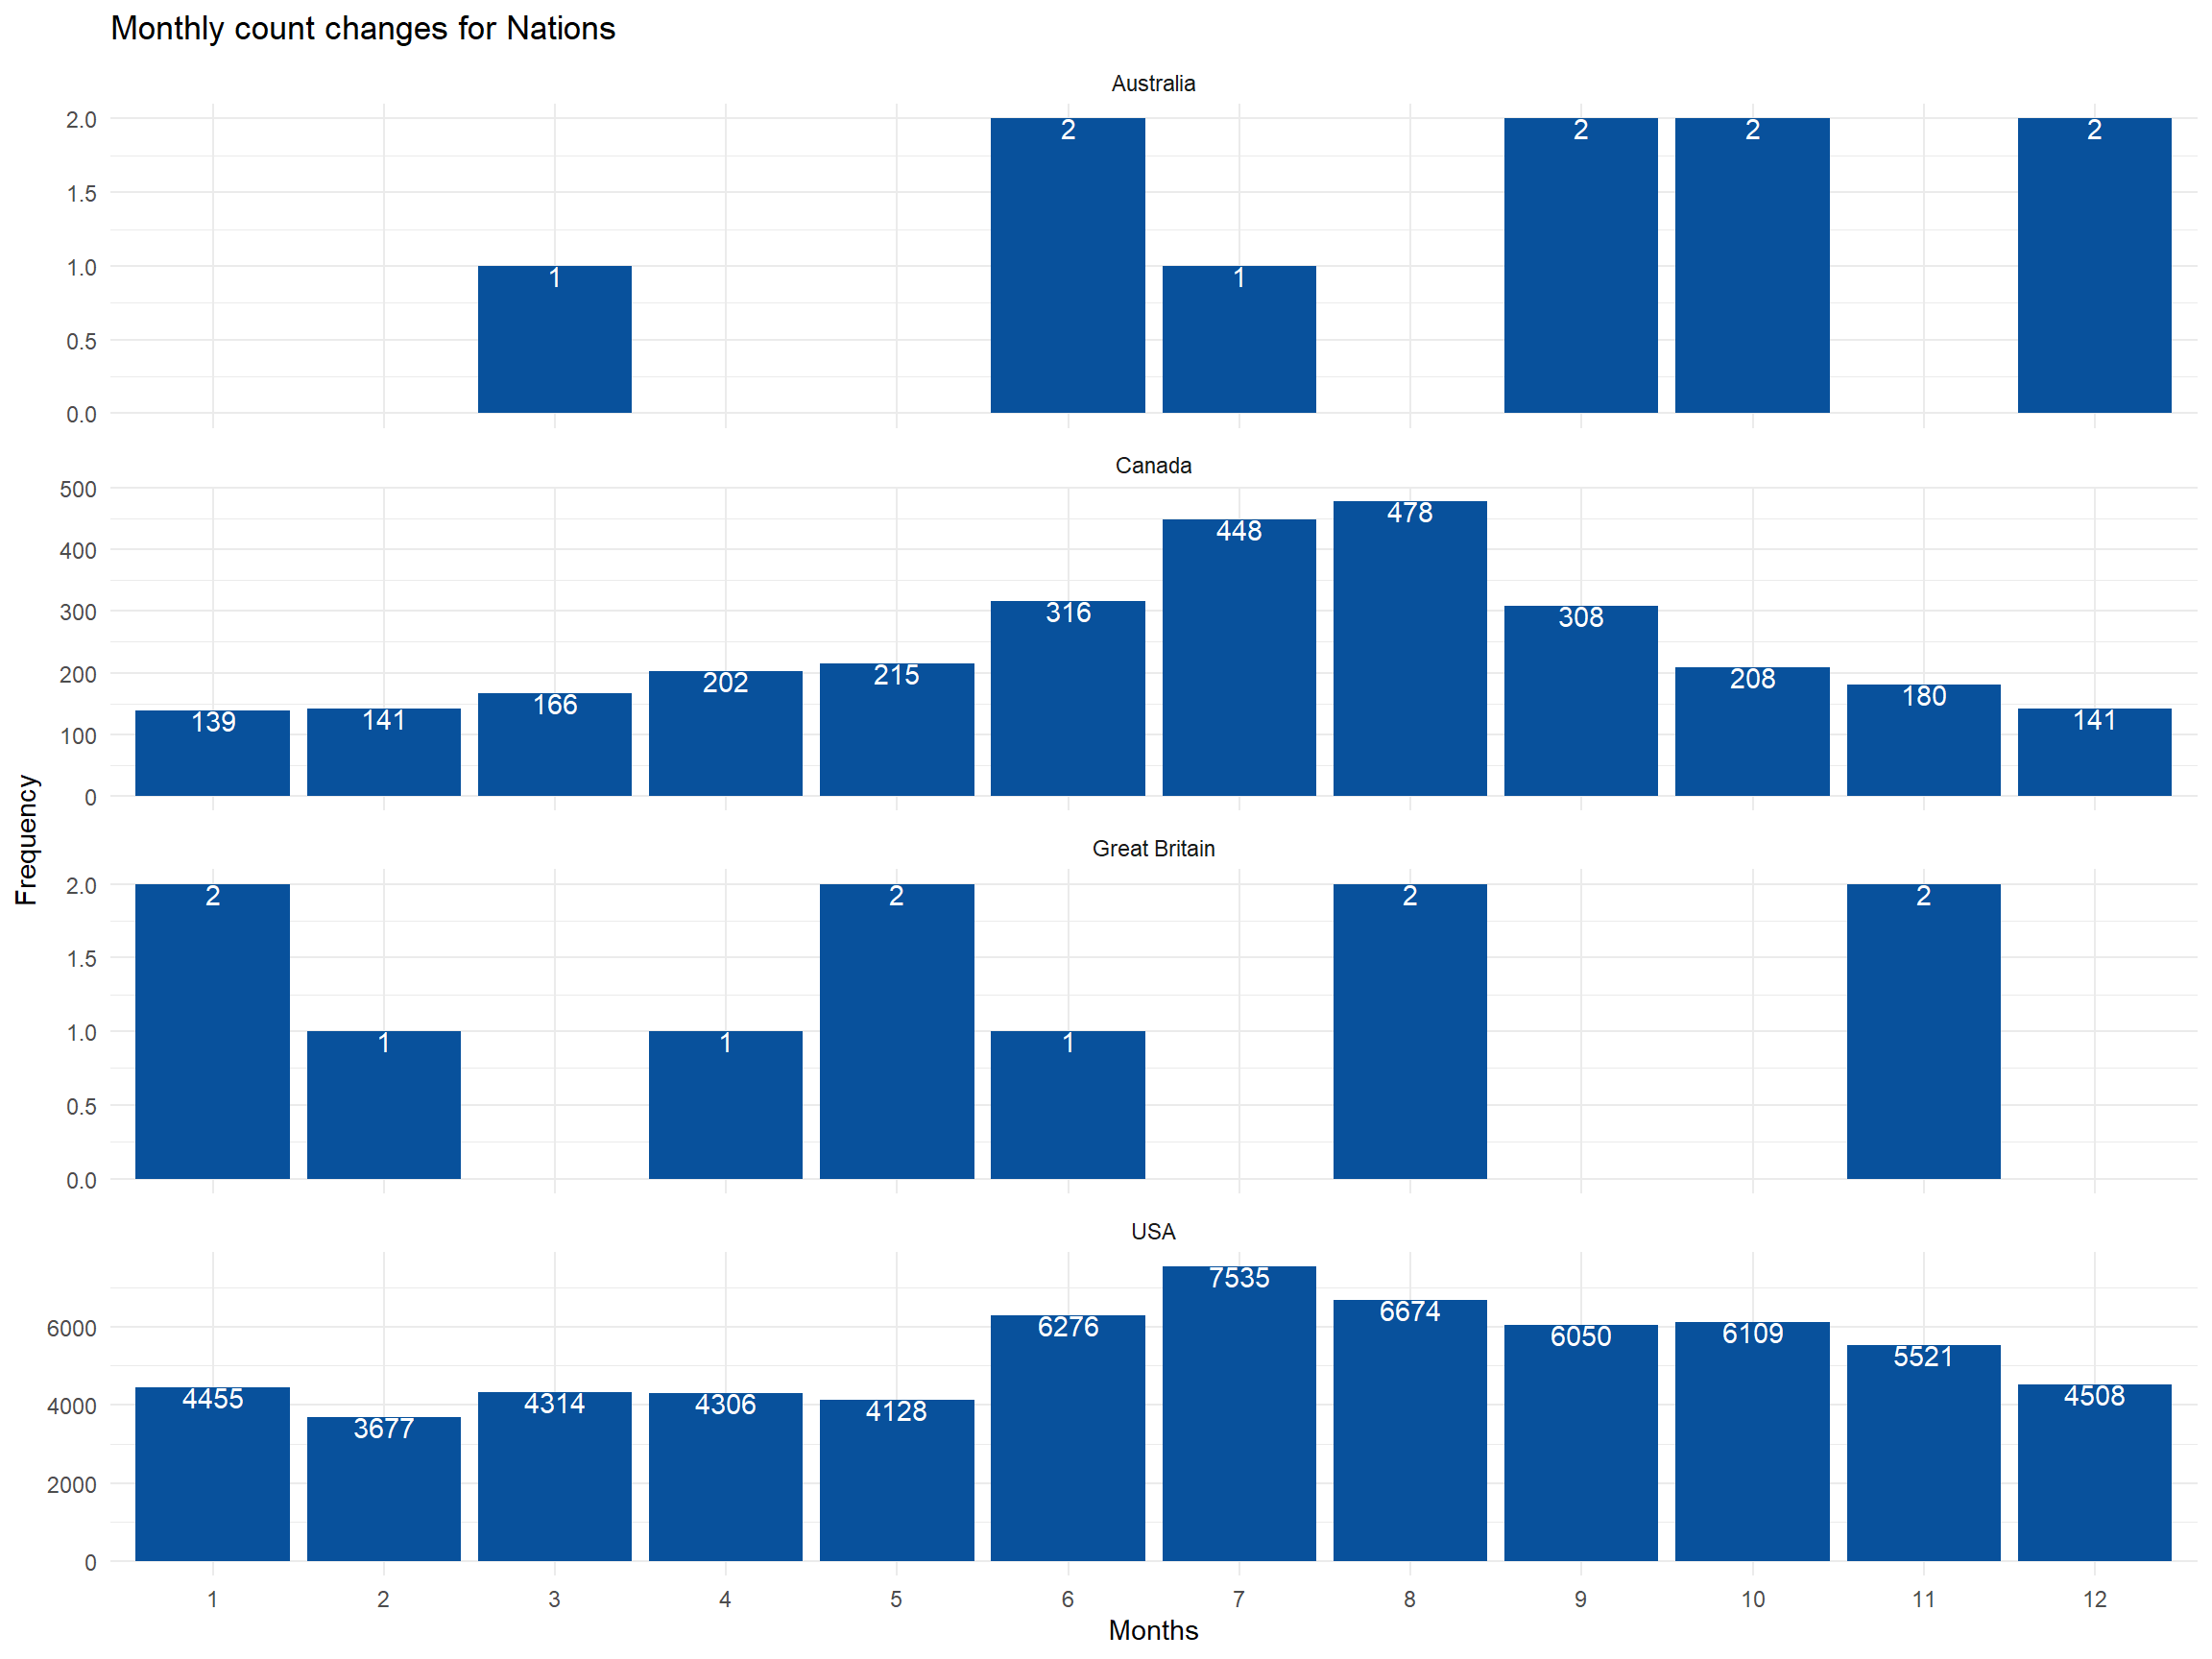
Hourly Count changes for Countries
ufo_sightings %>%
   mutate(hour=hour(date_time)) %>%
   mutate(country=recode_factor(country,
                                "au"="Australia",
                                "ca"="Canada",
                                "gb"="Great Britain",
                                "us"="USA")) %>%
   group_by(hour,country) %>%
   remove_missing() %>%
   count(country) %>%
   ggplot(.,aes(x=as.factor(hour),y=n))+geom_col(fill=blues9[8])+
         theme_minimal()+
         facet_wrap(~country,scales = "free_y",ncol = 1)+
         geom_text(aes(label=n),vjust=0.95,color="white")+
         xlab("Hours")+ylab("Frequency")+
         ggtitle("Hours count changes for Nations")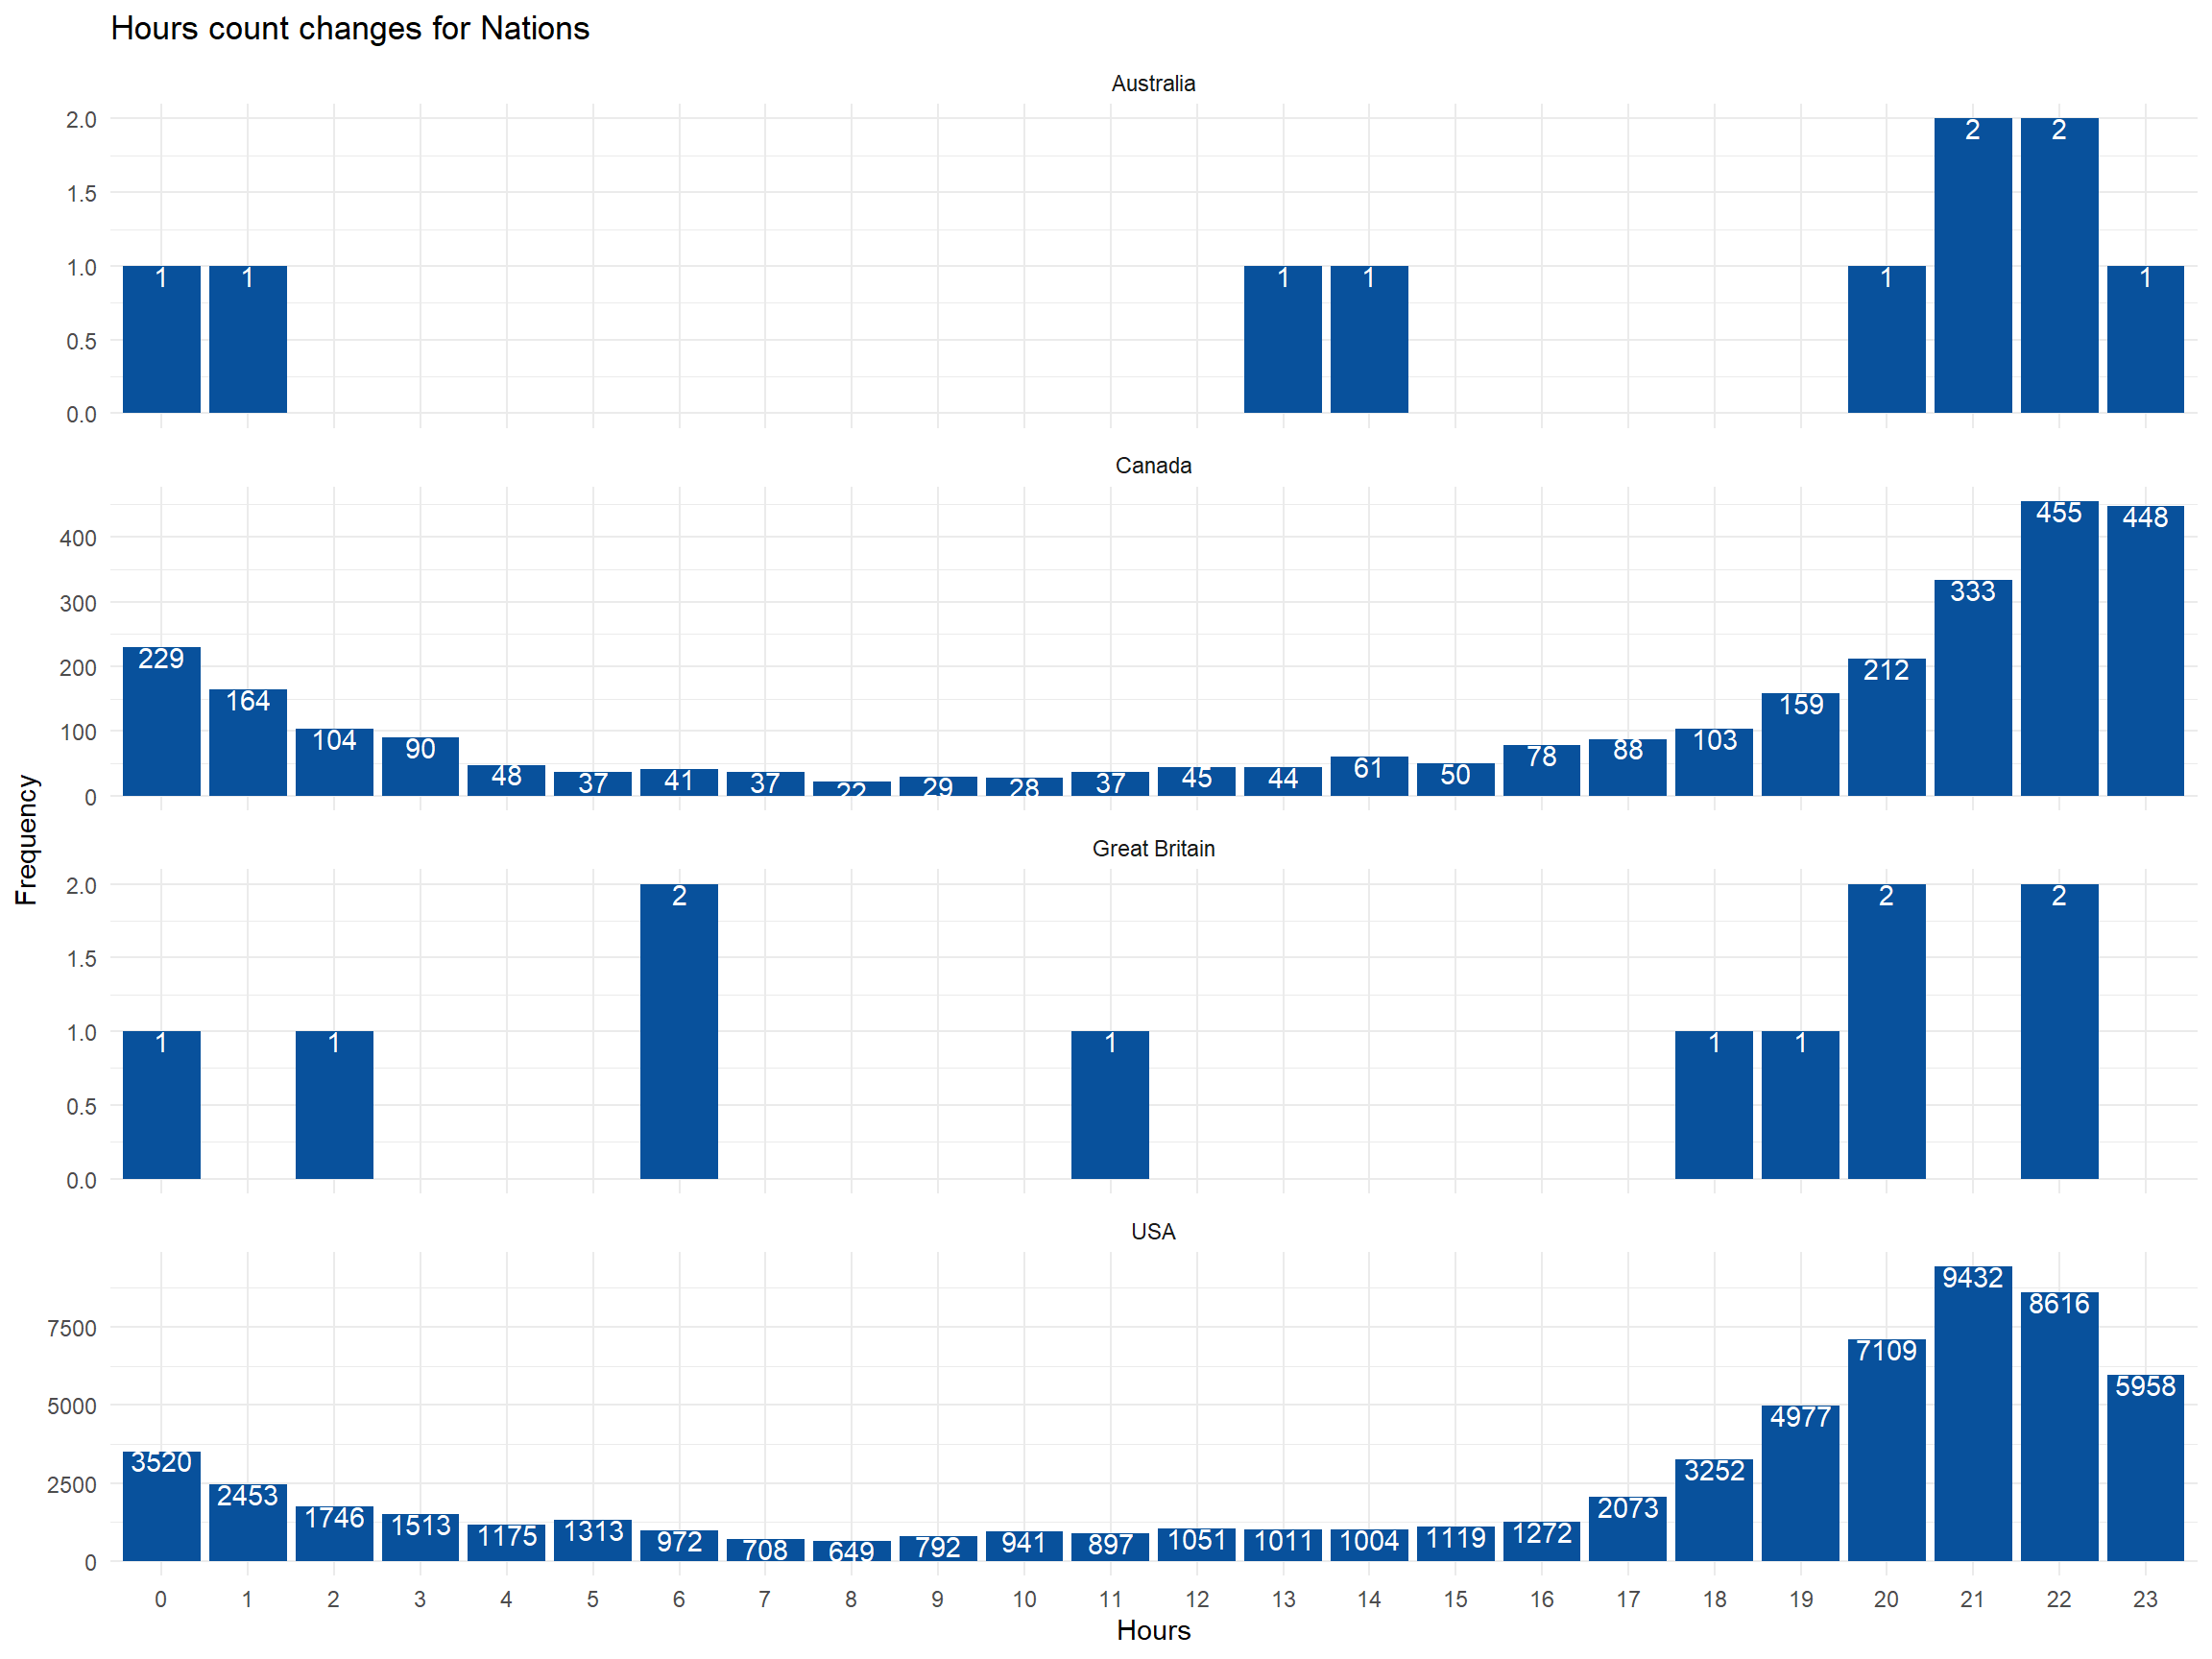
Decade wise UFO shape changes
ufo_sightings_new<-ufo_sightings

ufo_sightings_new$year<-year(ufo_sightings_new$date_time)

ufo_sightings_new$year<-cut(ufo_sightings_new$year,
                            breaks=c(1910,1919,1929,1939,
                                     1949,1959,1969,1979,
                                     1989,1999,2009,2015),
                            labels=c("1910s","1920s","1930s","1940s",
                                     "1950s","1960s","1970s","1980s",
                                     "1990s","2000s","2010s"))

ufo_sightings_new %>%
  group_by(year,ufo_shape) %>%
  count(ufo_shape) %>%
  remove_missing() %>%
  ggplot(.,aes(x=str_wrap(ufo_shape,10),y=n))+geom_col(fill=blues9[8])+
         theme_minimal()+
         theme(axis.text.x = element_text(angle = 90))+
         geom_text(aes(label=n),hjust=-0.1,angle=90)+
         scale_y_continuous(expand = c(0,1000))+
         transition_states(year)+ease_aes("linear")+
         xlab("Shape")+ylab("Frequency")+
         ggtitle("UFO shapes over the Years",
                 subtitle = "Year:{closest_state}")
Documented Year and Origin Year
ufo_sightings %>%
  mutate(o_year=year(date_time)) %>%
  mutate(d_year=year(mdy(date_documented))) %>%
  ggplot(.,aes(x=factor(o_year),y=factor(d_year)))+geom_jitter()+
         coord_flip()+theme_minimal()+
         ylab("Documented Year")+xlab("Origin Year")+
         ggtitle("Documented Year vs Origin Year")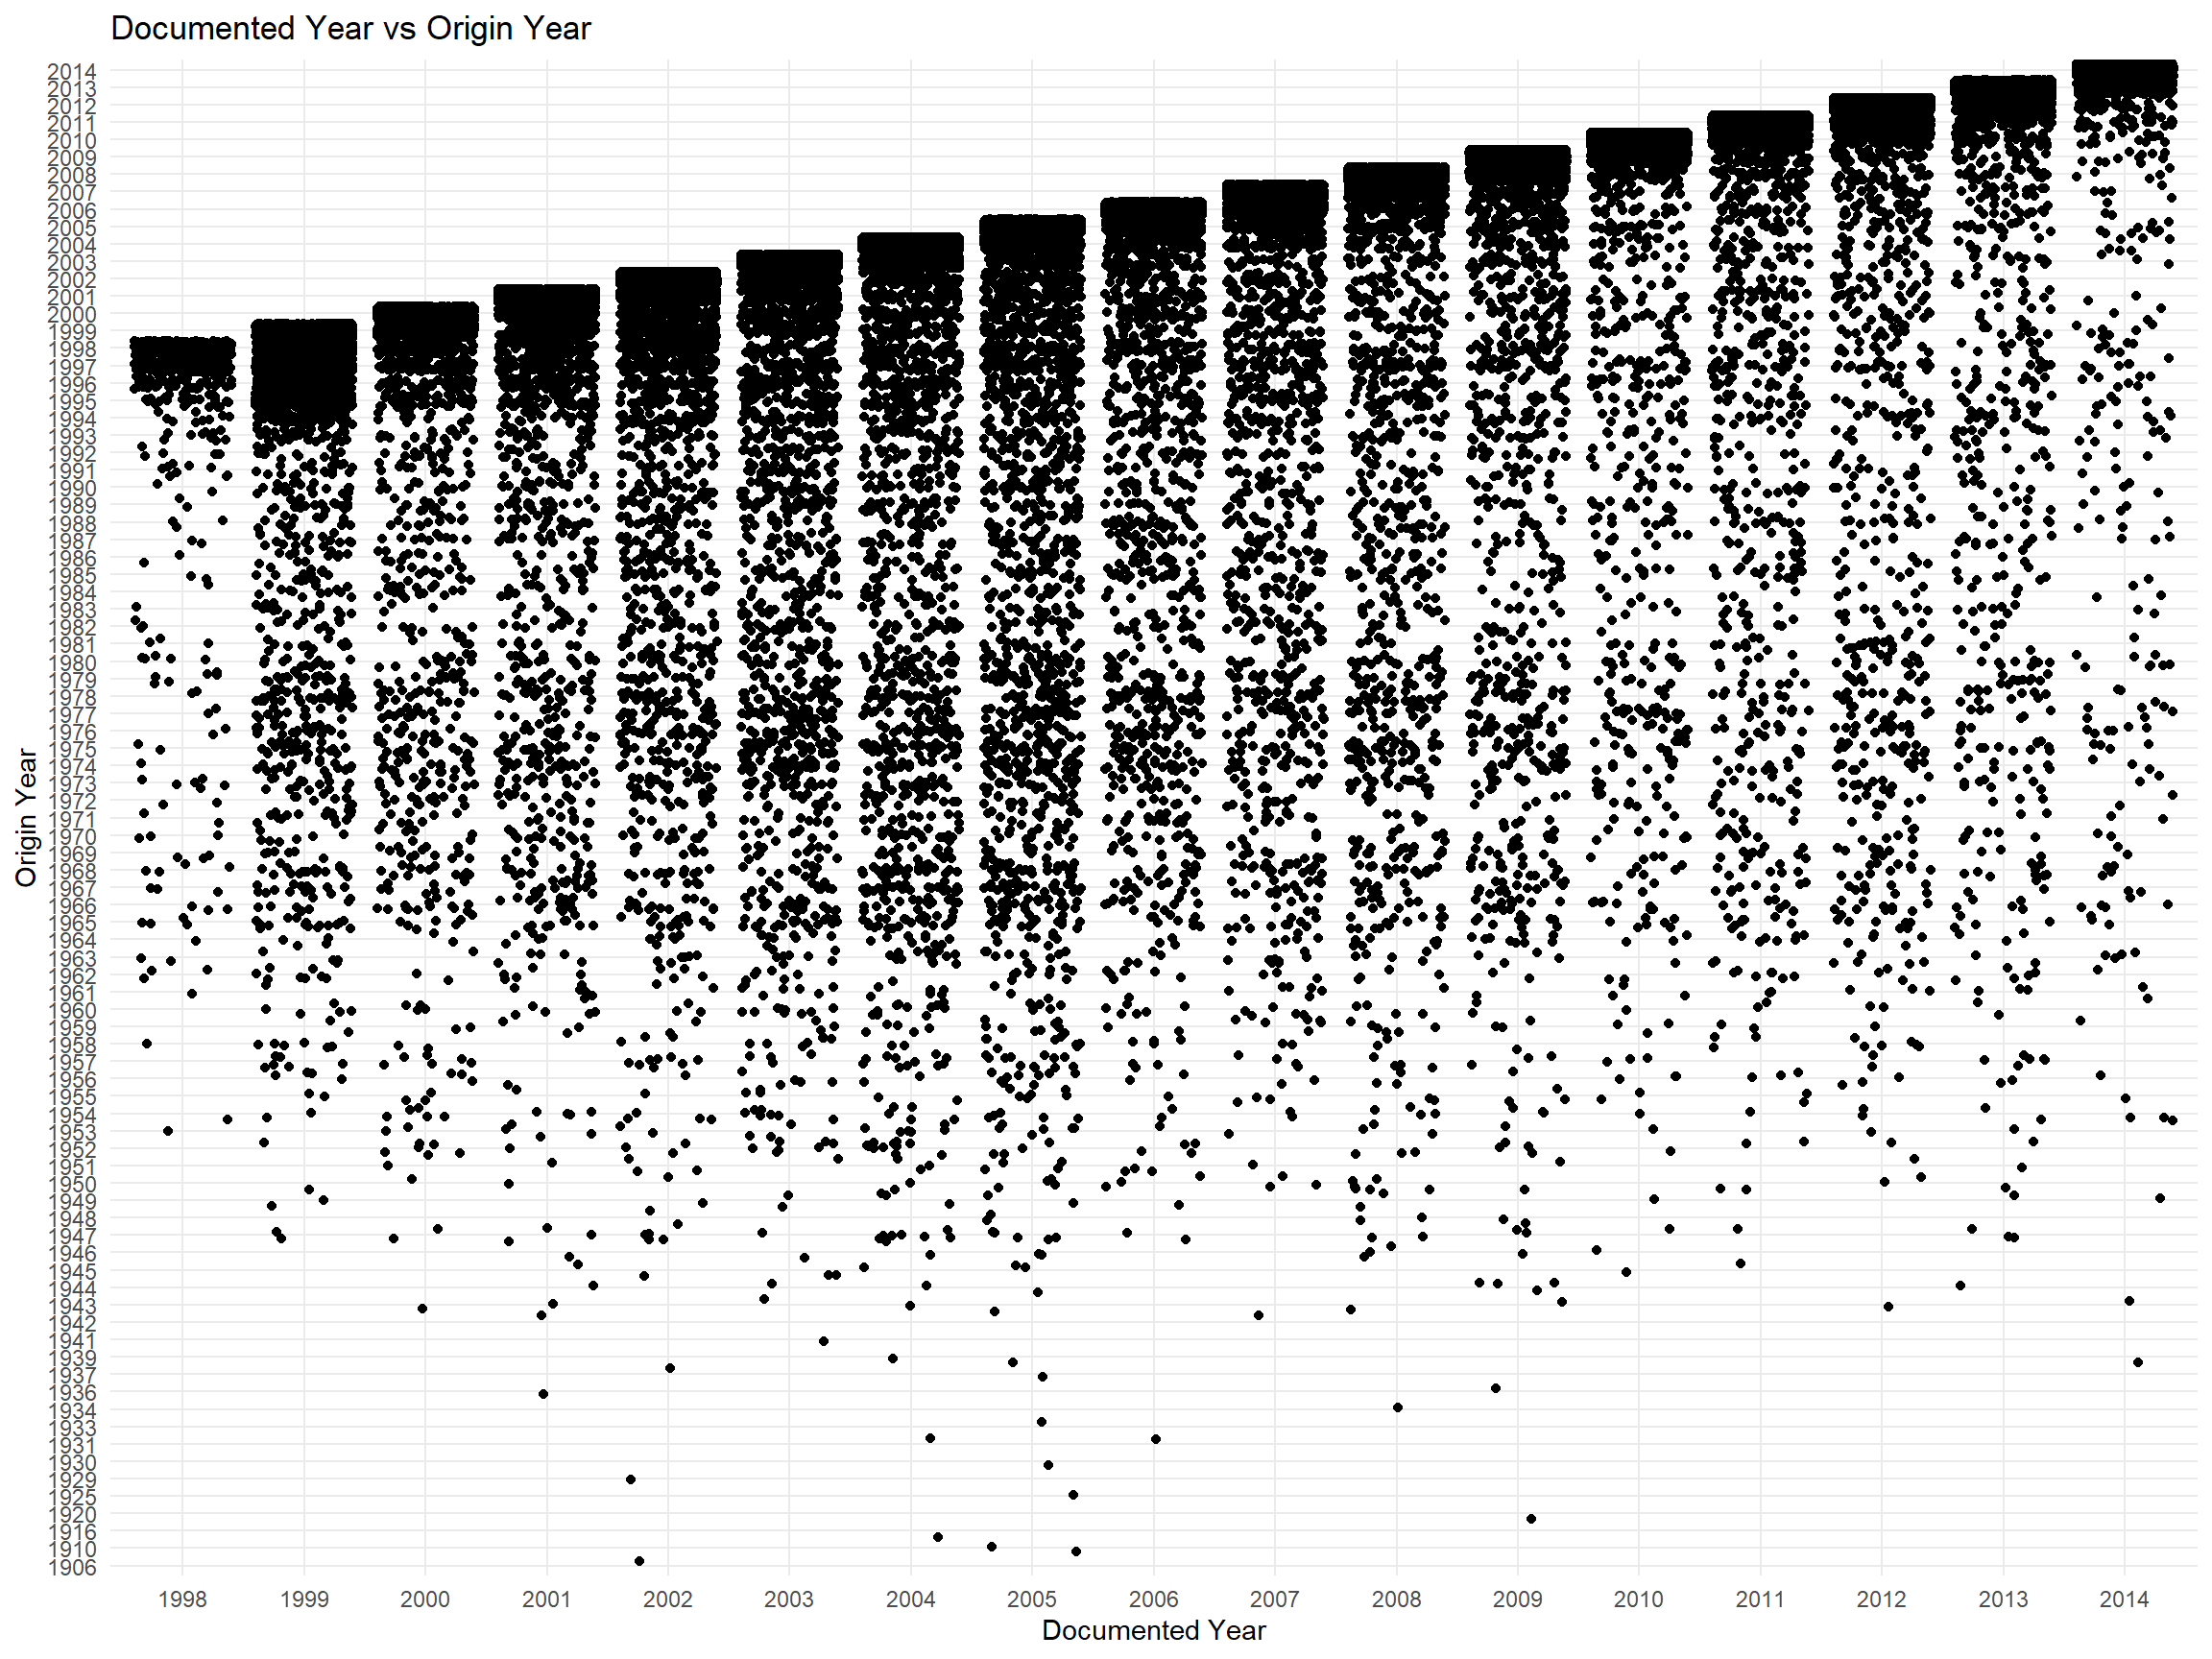
Year vs Encounter Length
ggthemr("flat")

ufo_sightings %>%
  mutate(year=year(date_time)) %>%
  remove_missing() %>%
  ggplot(.,aes(x=year,y=encounter_length,color=country))+geom_point()+
         facet_zoom(y=encounter_length <1000000)+
         xlab("Year")+ylab("Encounter Length")+
         ggtitle("Encounter Length over the Years",
                 subtitle = "Zoomed In for Encounter Length <1,000,000")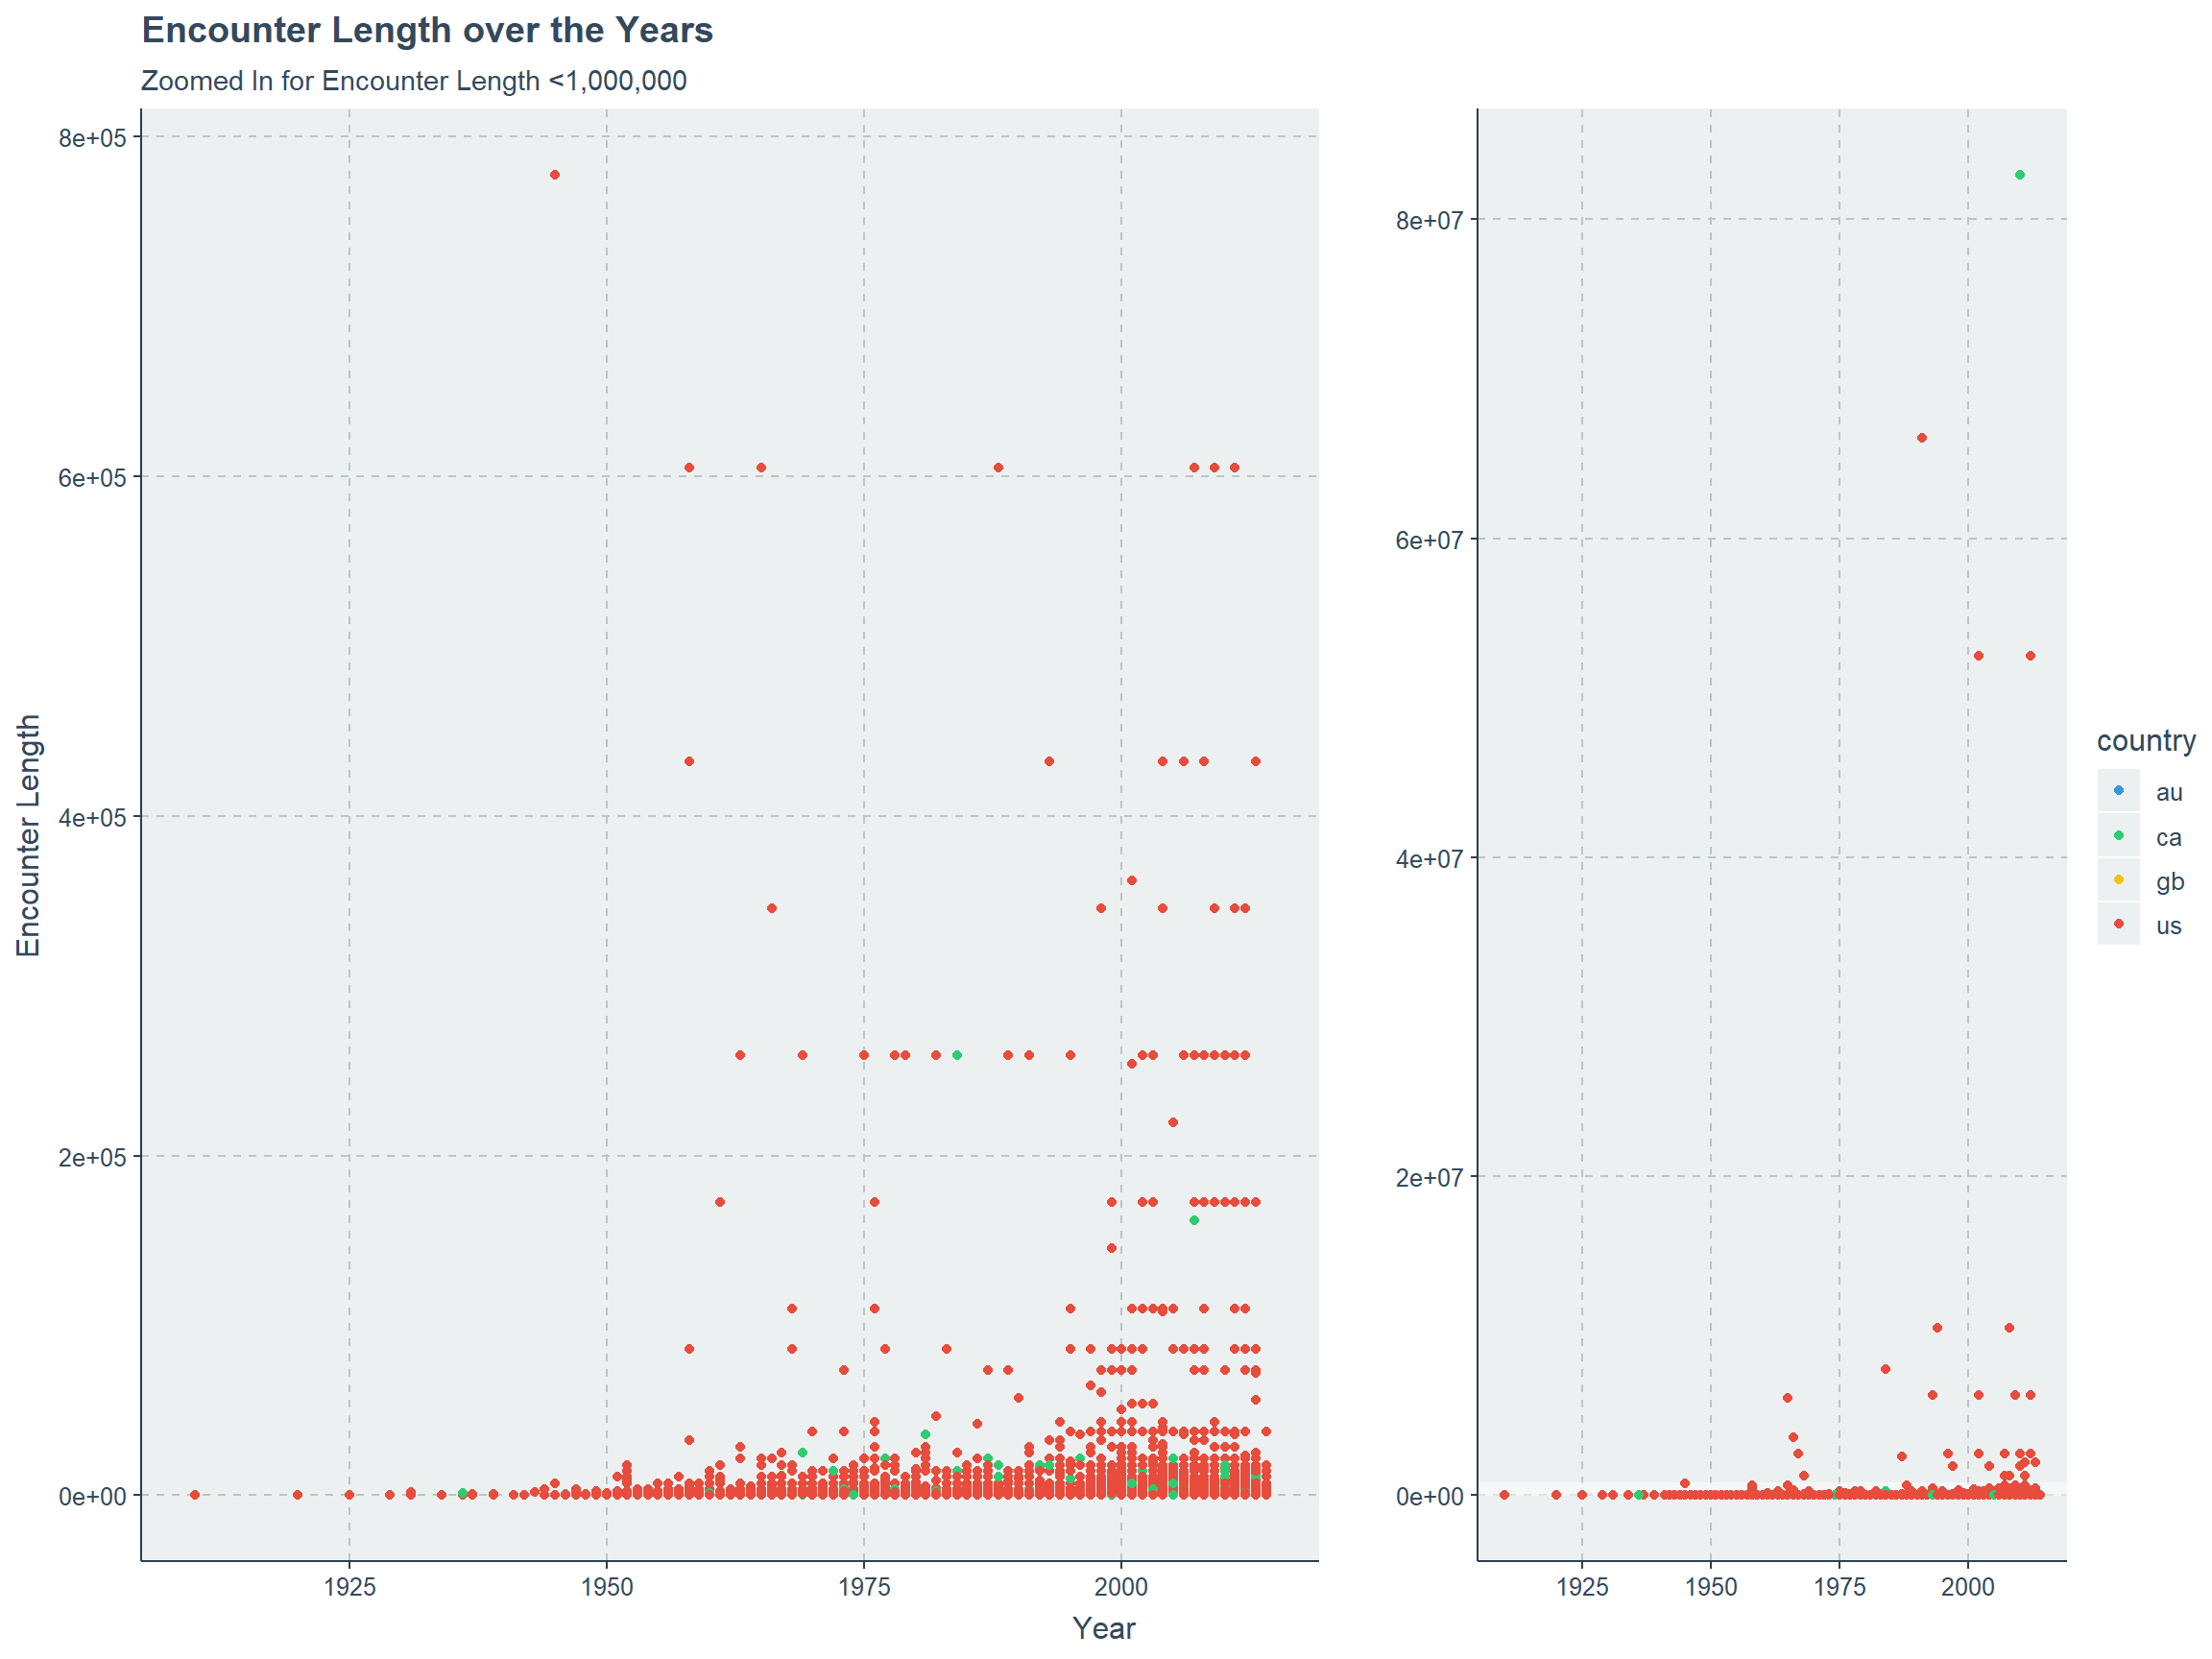
ufo_sightings %>%
  subset(encounter_length <1000000) %>%
  mutate(year=year(date_time)) %>%
  remove_missing() %>%
  ggplot(.,aes(x=year,y=encounter_length,color=country))+geom_point()+
        facet_zoom(y=encounter_length <100000)+
        xlab("Year")+ylab("Encounter Length")+
        ggtitle("Encounter Length < 1,000,000 over the Years",
                subtitle = "Zoomed In for Encounter Length <1,00,000")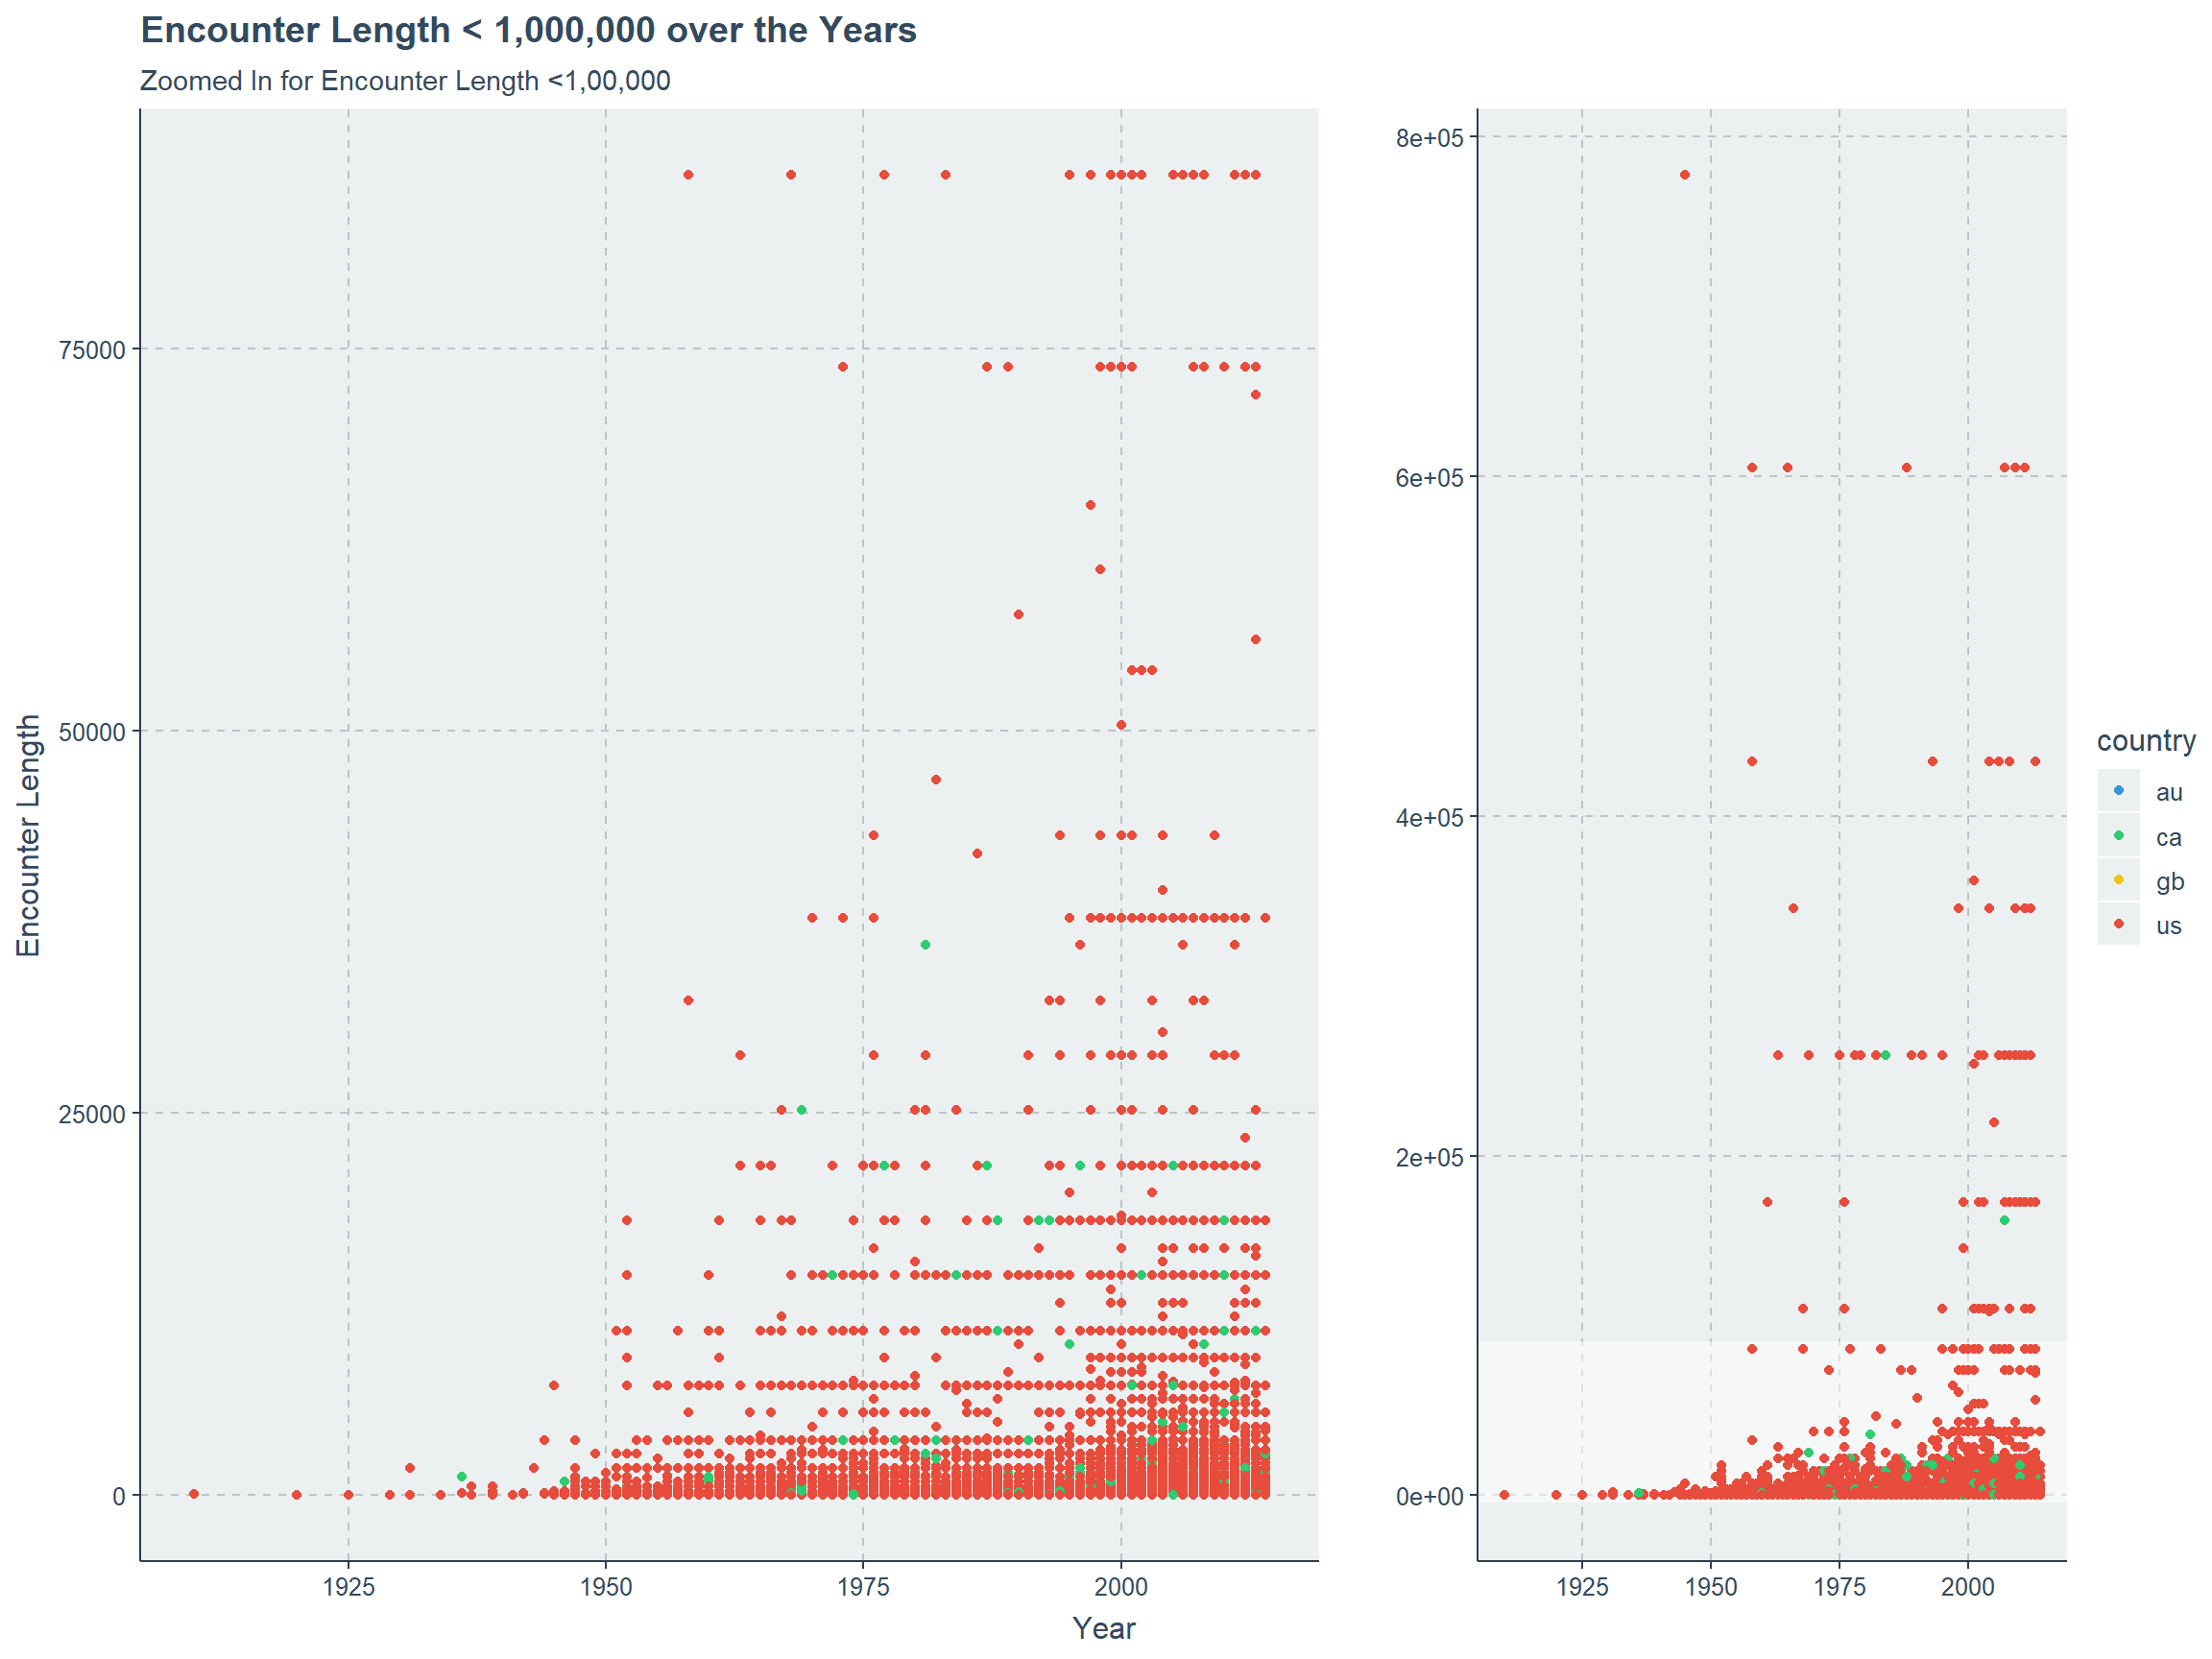
ufo_sightings %>%
  subset(encounter_length <100000) %>%
  mutate(year=year(date_time)) %>%
  remove_missing() %>%
  ggplot(.,aes(x=year,y=encounter_length,color=country))+geom_point()+
        facet_zoom(y=encounter_length <10000)+
        xlab("Year")+ylab("Encounter Length")+
        ggtitle("Encounter Length < 100,000 over the Years",
                subtitle = "Zoomed In for Encounter Length <10,000")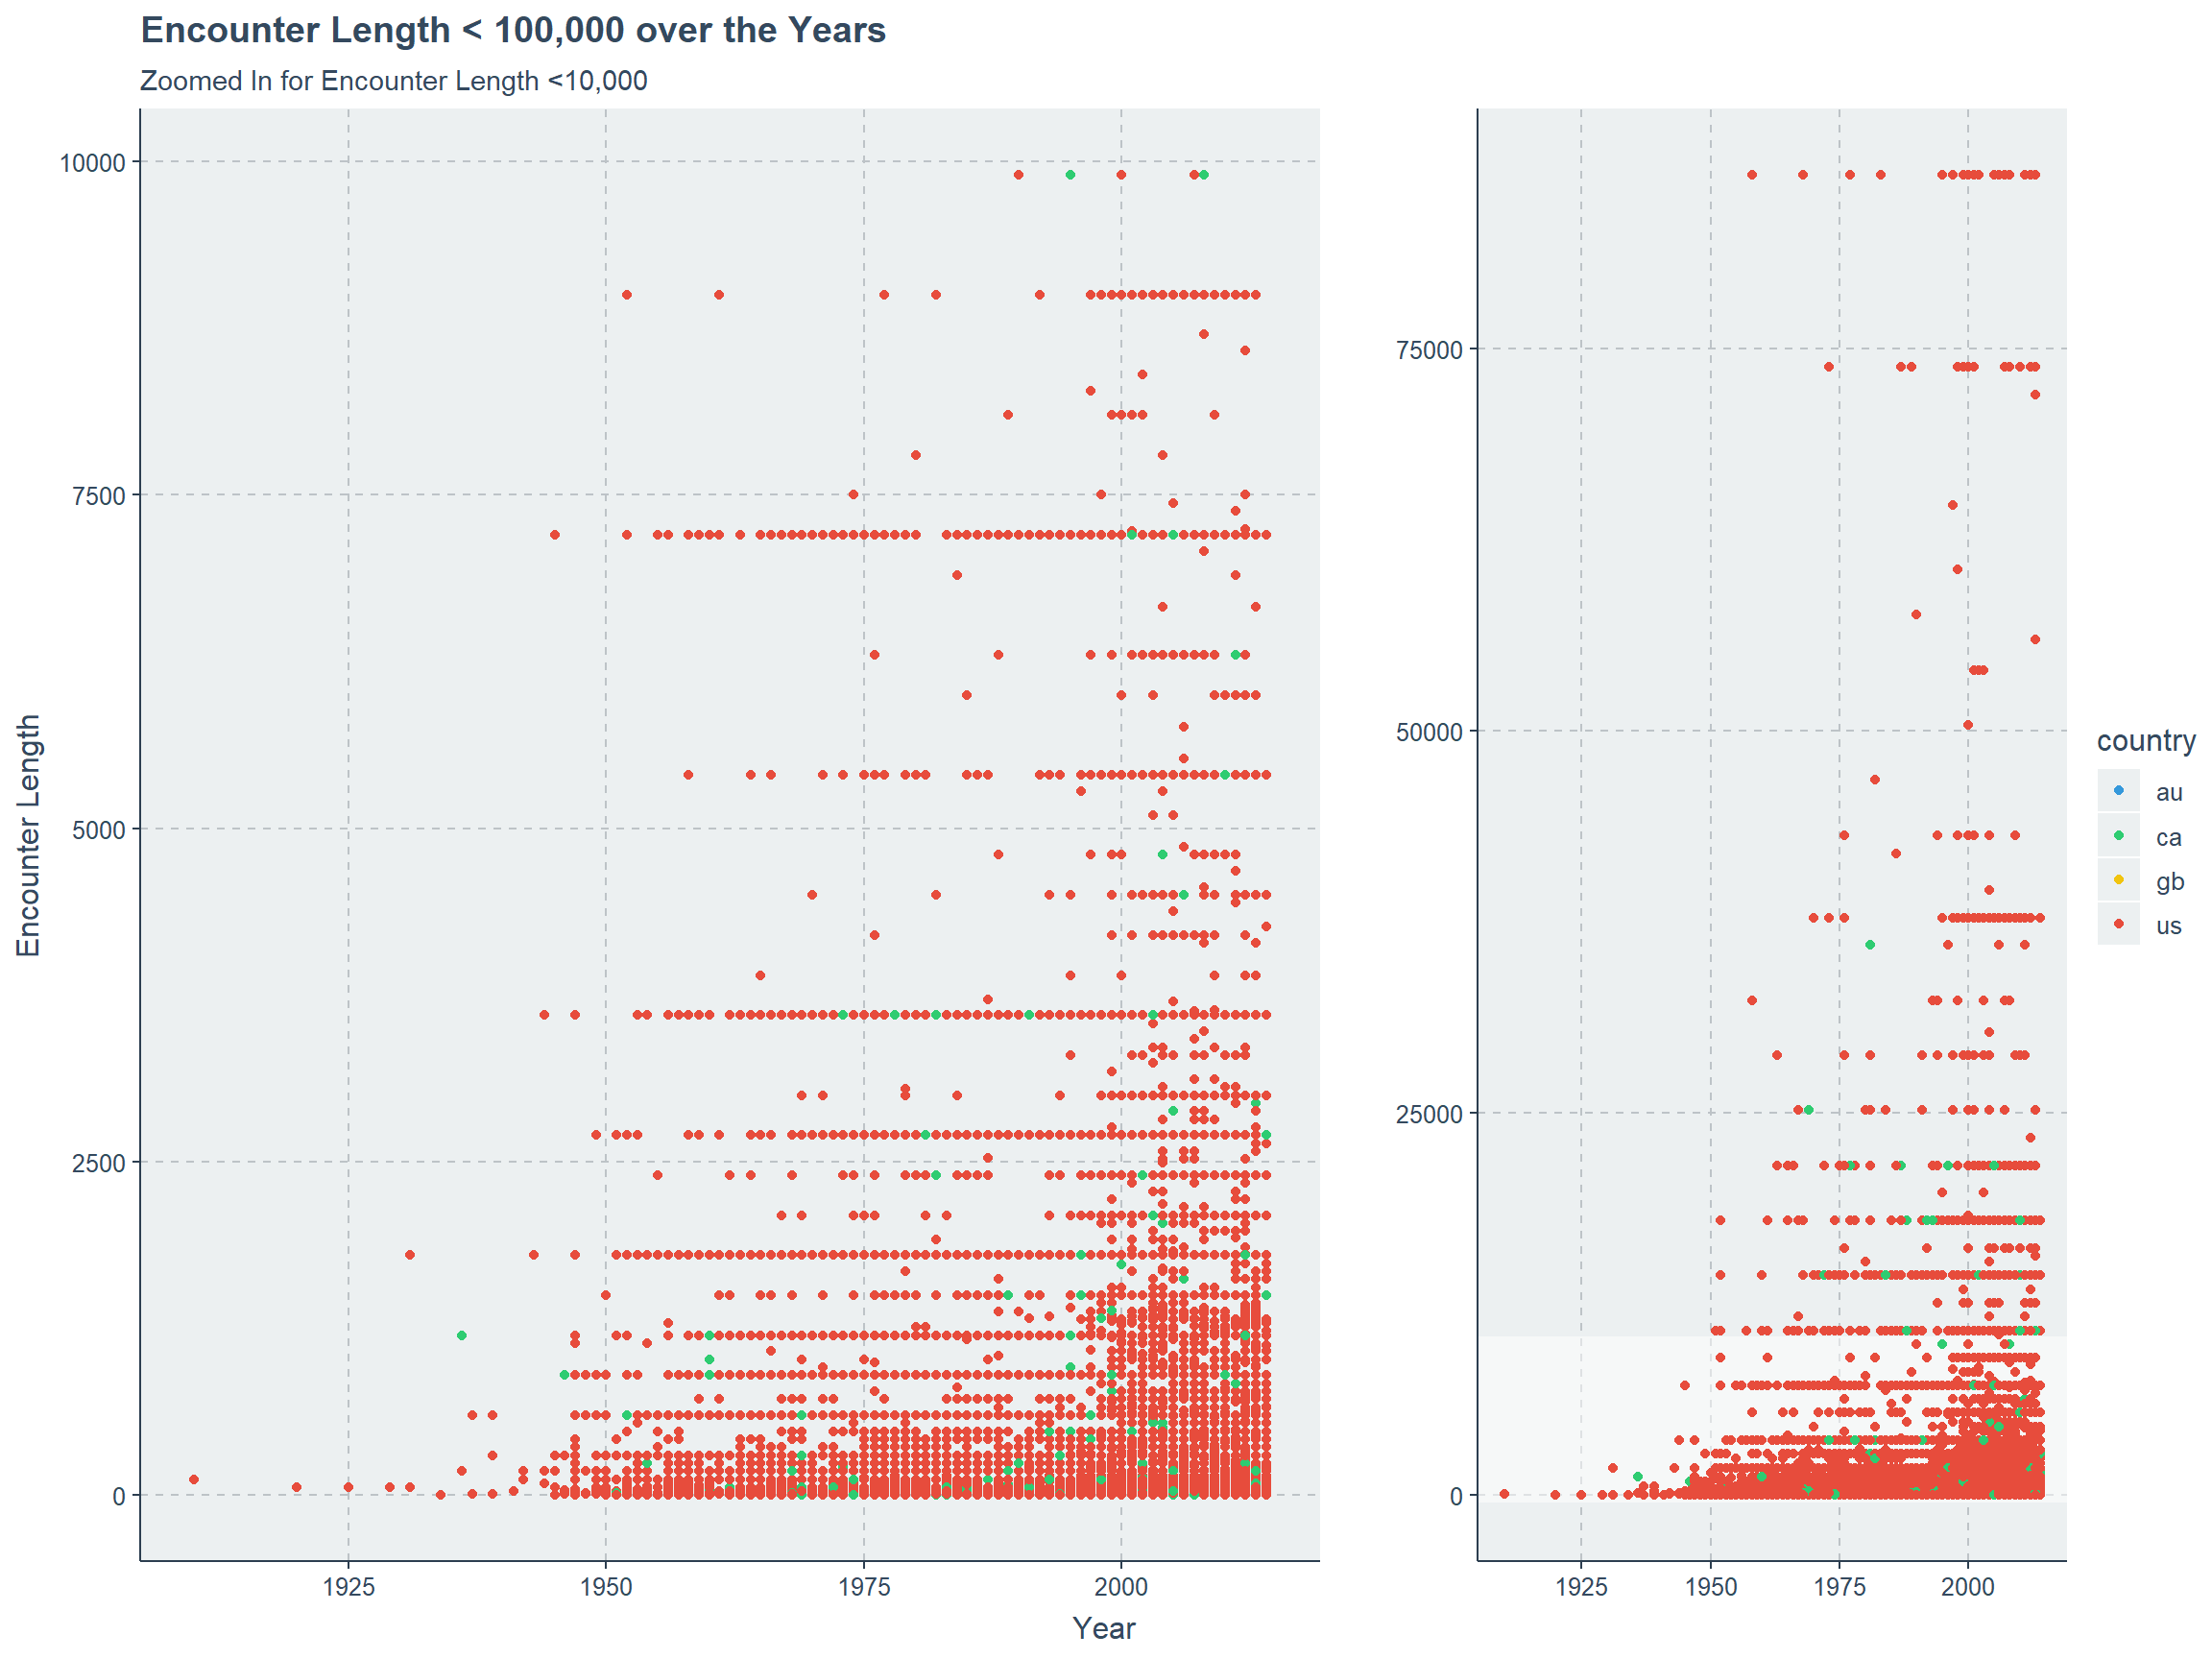
Hour vs Encounter Length
ufo_sightings %>%
  mutate(hour=hour(date_time)) %>%
  remove_missing() %>%
  ggplot(.,aes(x=hour,y=encounter_length,color=country))+geom_jitter()+
        facet_zoom(y=encounter_length <1000, x=hour >=20)+
        xlab("Hour")+ylab("Encounter Length")+
        ggtitle("Encounter Length over the Years",
                subtitle = "Zoomed In for Encounter Length <1,000")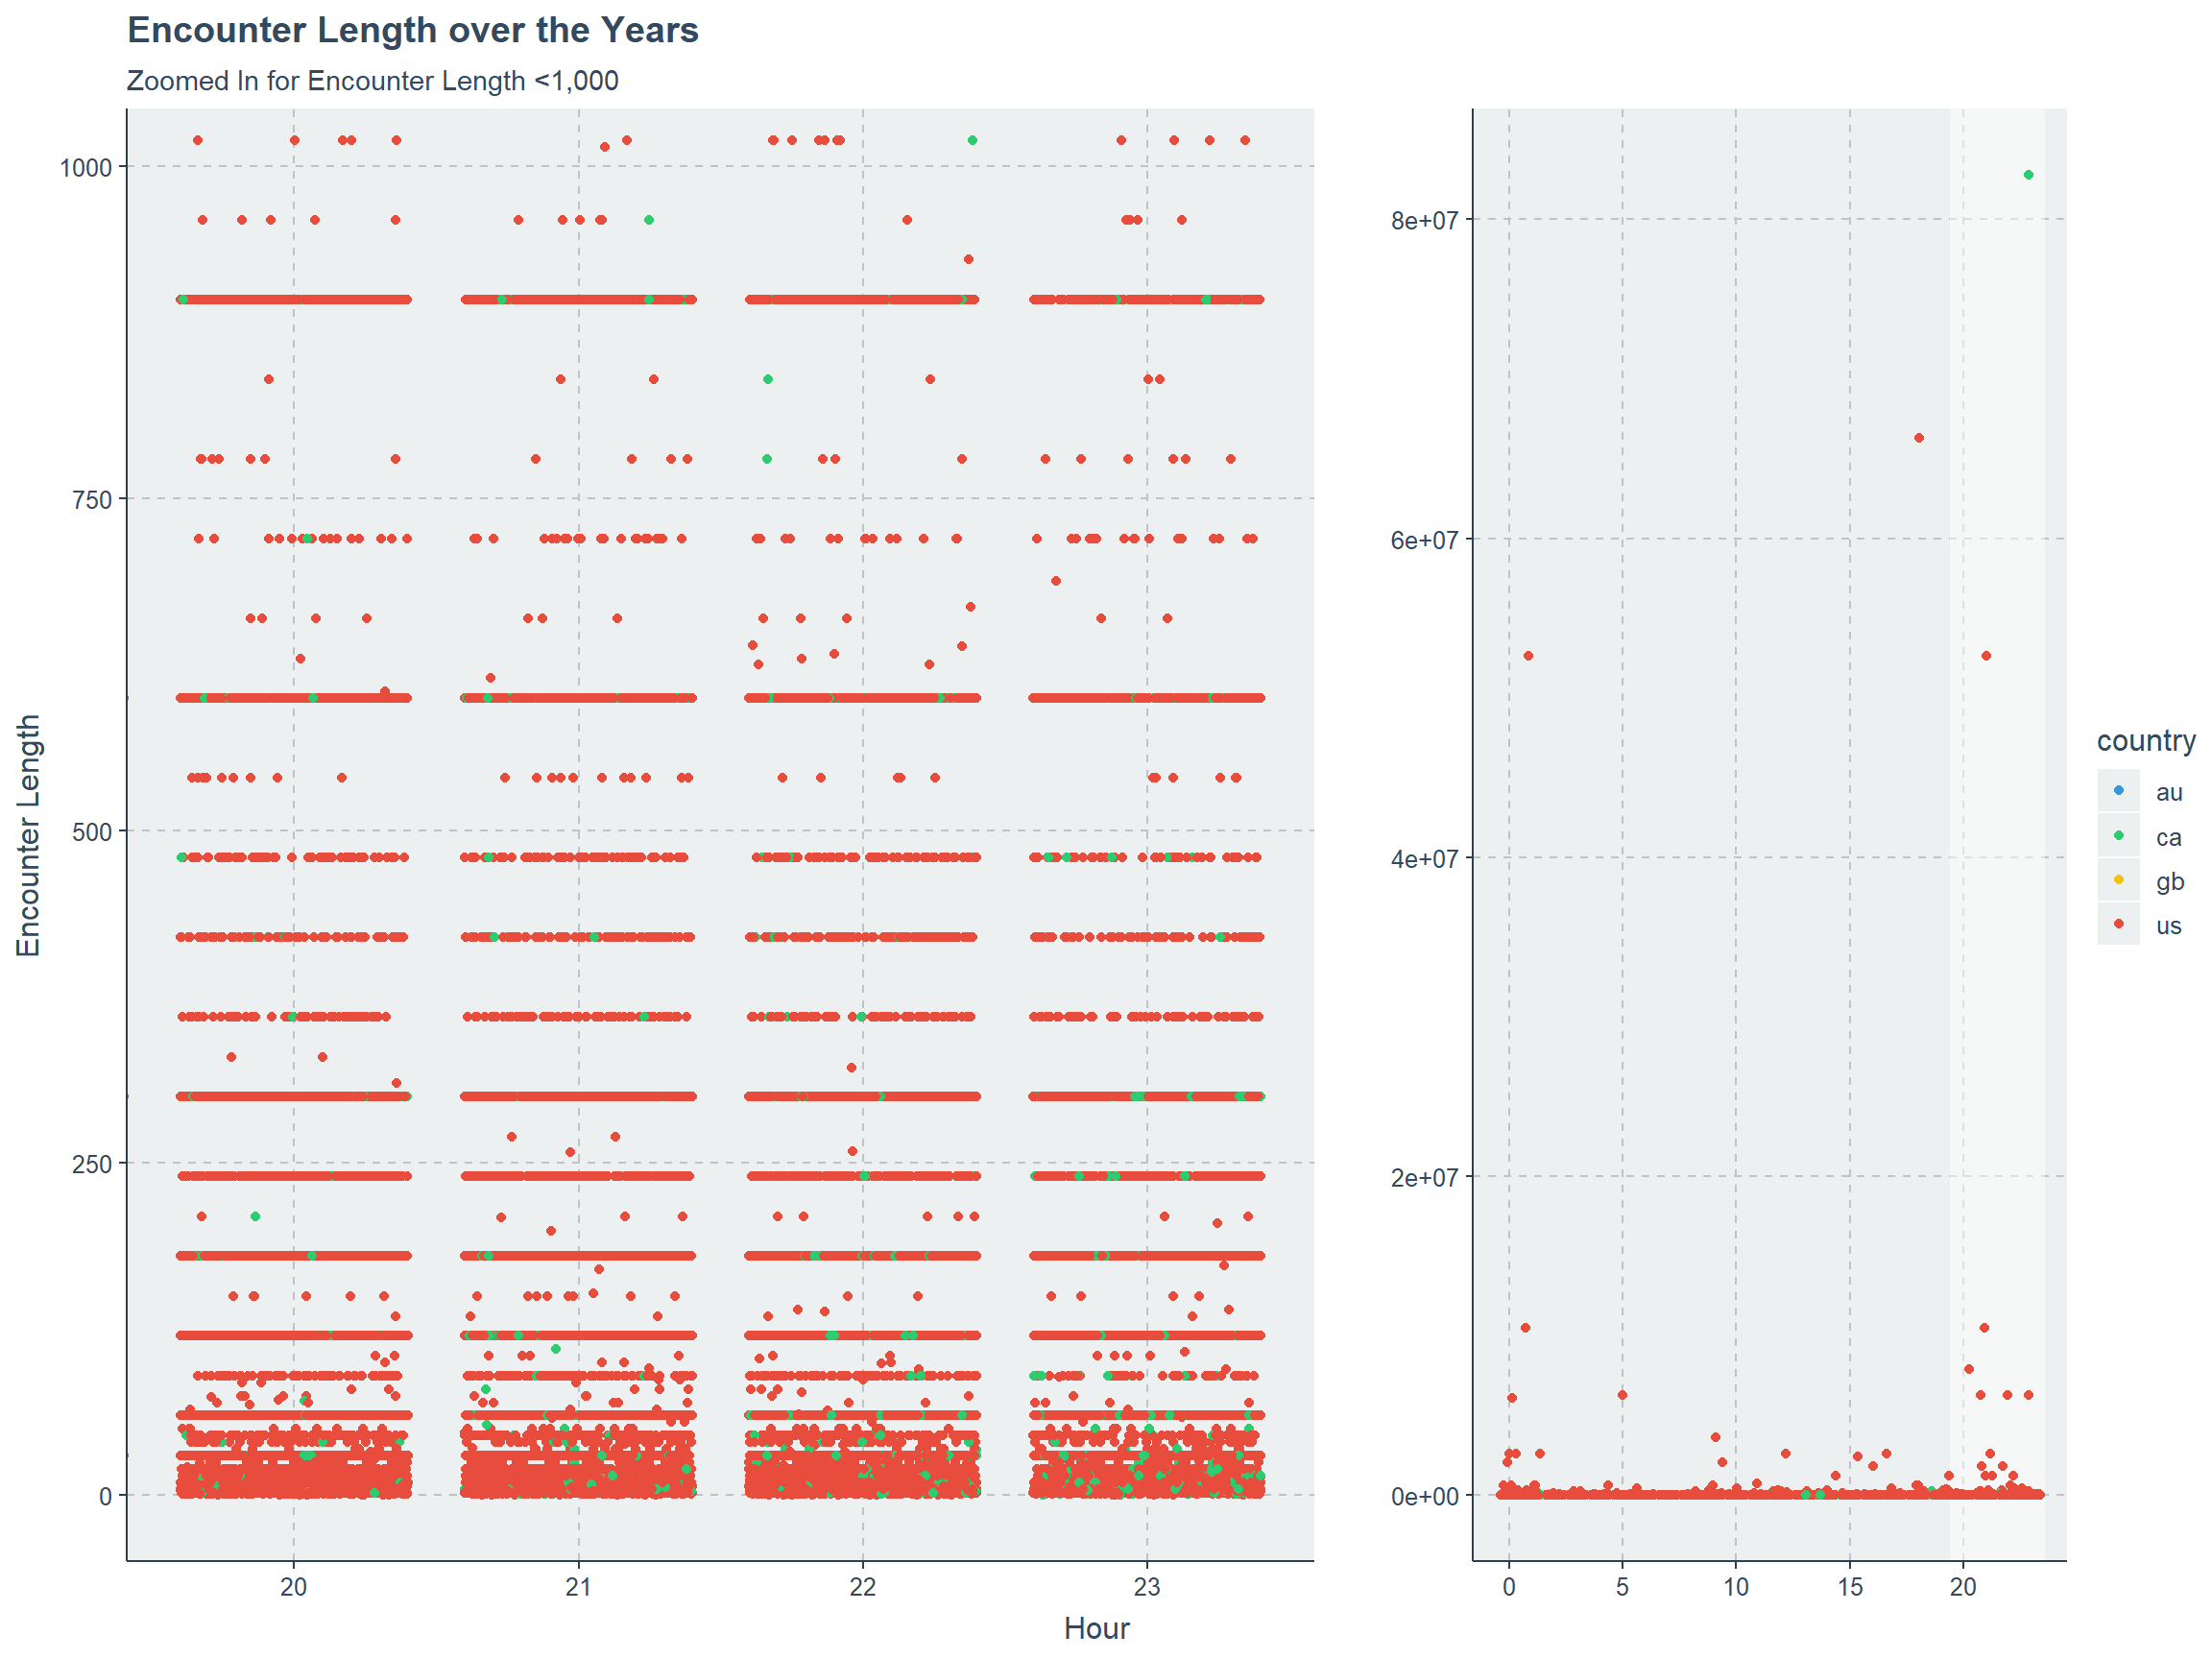
THANK YOU