bird_counts <- readr::read_csv("https://raw.githubusercontent.com/rfordatascience/tidytuesday/master/data/2019/2019-06-18/bird_counts.csv")
library(tidyverse)
library(gganimate)
library(ggthemr)
ggthemr('flat')What happened after the millennium ? why does the amount drop for "How many counted". Specially considering the top 10 species based on overall data. #TidyTuesday Github: https://t.co/8oovW8f3xg pic.twitter.com/nkdXYkZN5r
— Amalan Mahendran (@Amalan_Con_Stat) June 18, 2019
Year with How many counted, How many counted by Hour and Total Hours
p1<-bird_counts %>%
ggplot(.,aes(year,how_many_counted,color=how_many_counted_by_hour,
label=species))+
geom_point()+labs(color="Counted by Hour")+
xlab("Year")+ylab("How Many Counted")+
ggtitle("How many Counted vs Year")
plotly::ggplotly(p1)p2<-bird_counts %>%
ggplot(.,aes(year,total_hours,color=how_many_counted_by_hour,
label=species))+
geom_point()+labs(color="Counted by Hour")+
xlab("Year")+ylab("Total Hours")+
ggtitle("Total Hours vs Year")
plotly::ggplotly(p2)Year and Total Hours by decade
bird_counts_new<-bird_counts
bird_counts_new$year<-cut(bird_counts_new$year,
breaks=c(1920,1929,1939,1949,
1959,1969,1979,1989,
1999,2009,2017),
labels=c("1920s","1930s","1940s","1950s",
"1960s","1970s","1980s","1990s",
"2000s","2010s"))
bird_counts_new %>%
replace_na(list(total_hours = 0)) %>%
group_by(year) %>%
summarise(mean_hours=mean(total_hours),sum_hours=sum(total_hours)) %>%
ggplot(.,aes(year,sum_hours))+geom_col()+
xlab("Year")+ylab("Summation of Total Hours \n(Mean Total Hours)")+
ggtitle("Total Hours by Decade")+
scale_y_continuous(expand=c(0,25000))+
geom_text(aes(label=sum_hours),size=3.5,vjust=-0.5)+
geom_text(aes(label=round(mean_hours,2)),vjust=1)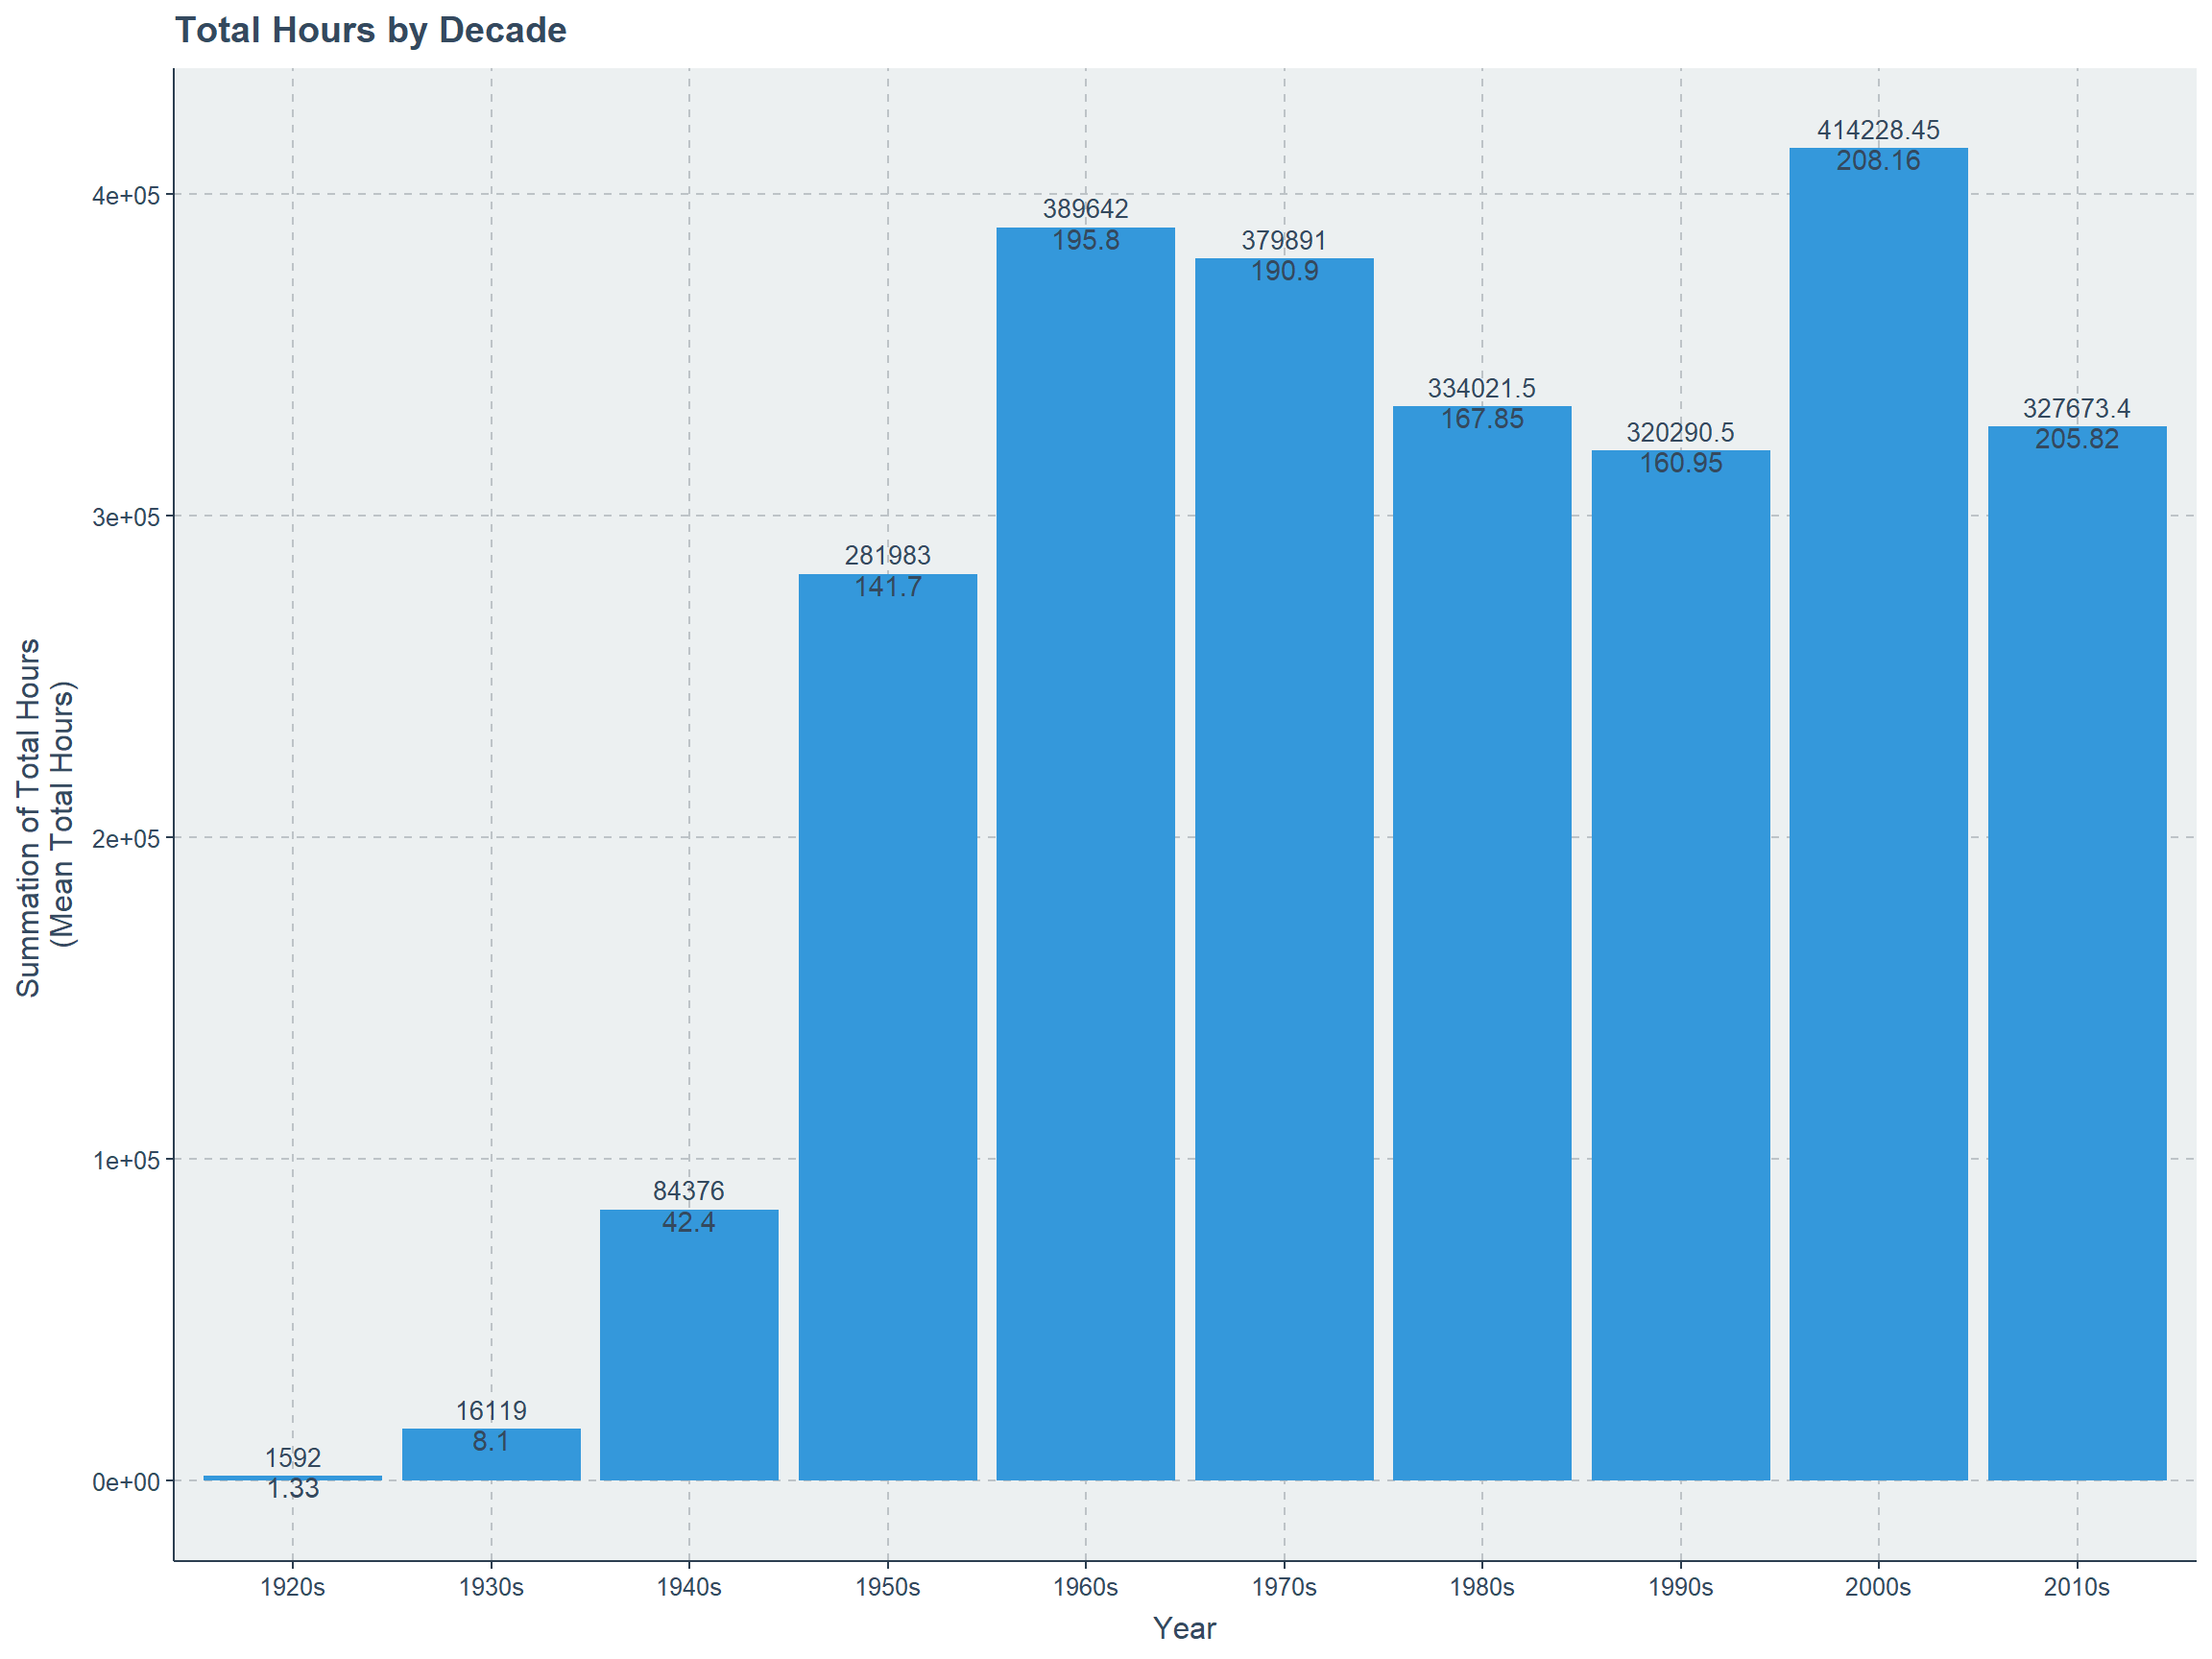
Year and How many Counted by decade
bird_counts_new<-bird_counts
bird_counts_new$year<-cut(bird_counts_new$year,
breaks=c(1920,1929,1939,1949,
1959,1969,1979,1989,
1999,2009,2017),
labels=c("1920s","1930s","1940s","1950s",
"1960s","1970s","1980s","1990s",
"2000s","2010s"))
bird_counts_new %>%
replace_na(list(how_many_counted = 0)) %>%
group_by(year) %>%
summarise(mean_counted=mean(how_many_counted),
sum_counted=sum(how_many_counted)) %>%
ggplot(.,aes(year,sum_counted))+geom_col()+
xlab("Year")+ylab("Summation of How Many Counted \n(Mean of How many counted)")+
ggtitle("Total of How many counted")+
scale_y_continuous(expand=c(0,75000))+
geom_text(aes(label=sum_counted),size=3.5,vjust=-0.5)+
geom_text(aes(label=round(mean_counted,2)),vjust=1)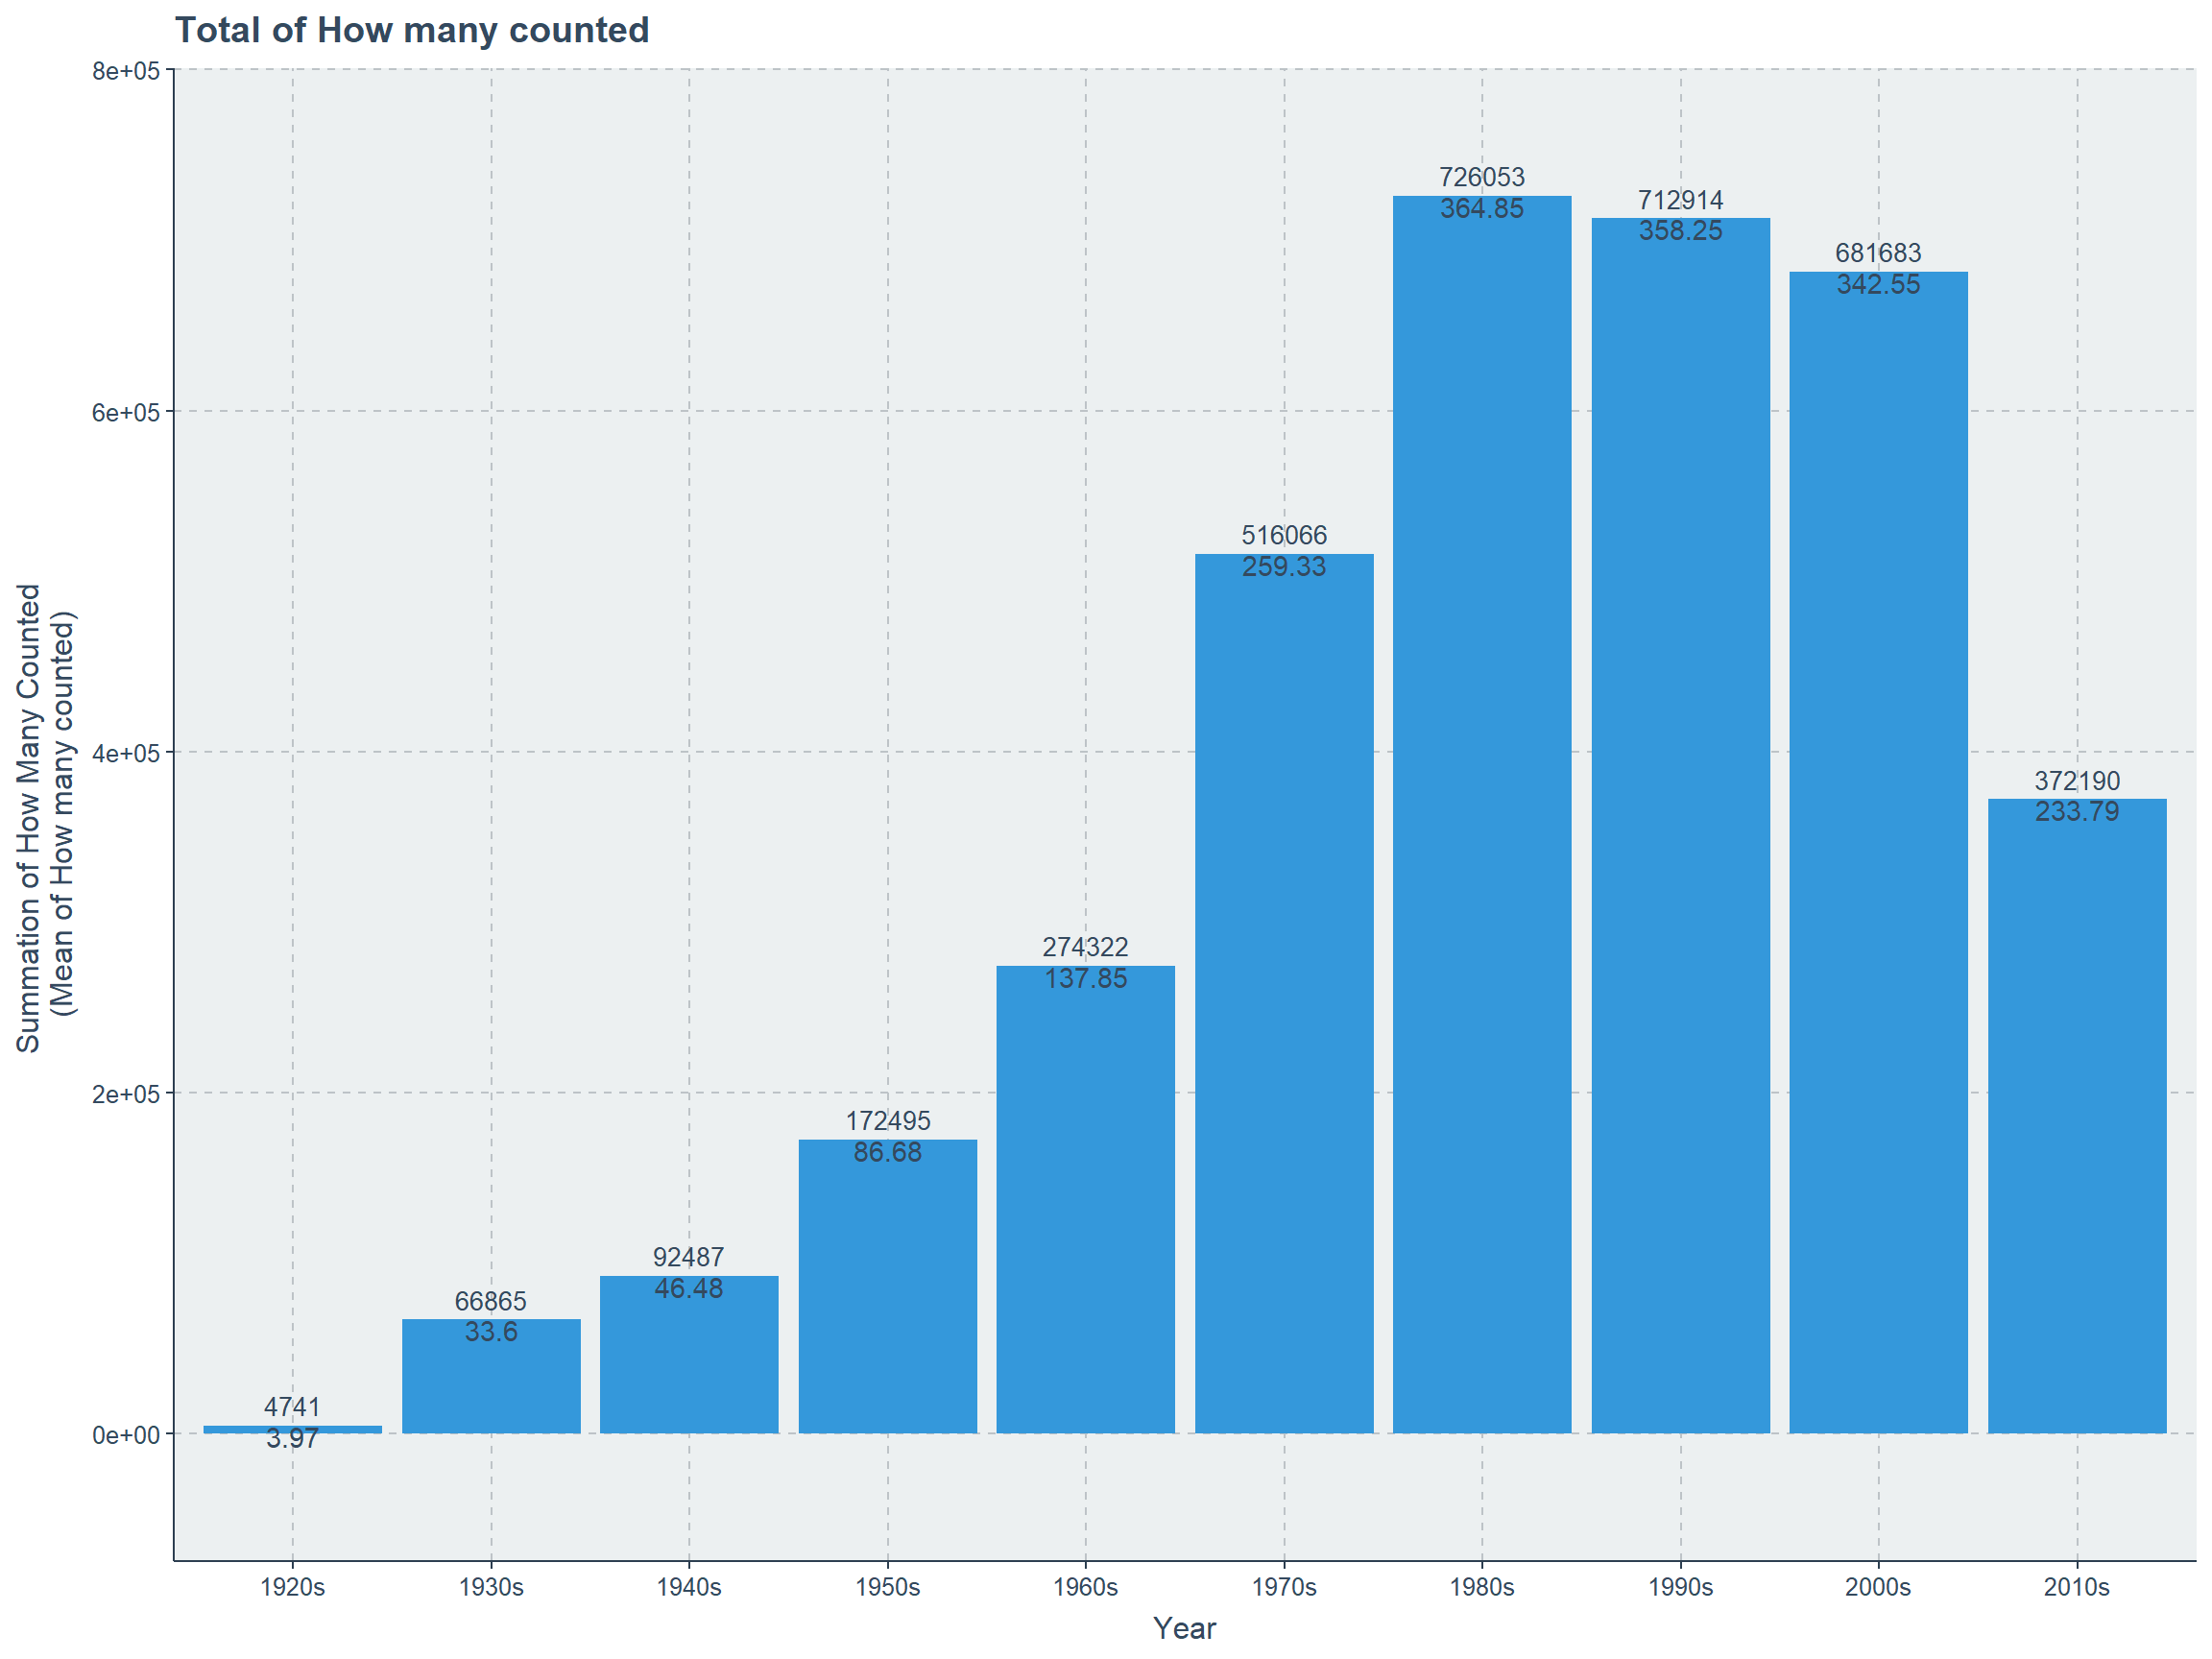
Year and How many Hours Counted by Hour for decade
bird_counts_new<-bird_counts
bird_counts_new$year<-cut(bird_counts_new$year,
breaks=c(1920,1929,1939,1949,
1959,1969,1979,1989,
1999,2009,2017),
labels=c("1920s","1930s","1940s","1950s",
"1960s","1970s","1980s","1990s",
"2000s","2010s"))
bird_counts_new %>%
replace_na(list(how_many_counted_by_hour = 0)) %>%
group_by(year) %>%
summarise(mean_counted_hour=mean(how_many_counted_by_hour),
sum_counted_hour=sum(how_many_counted_by_hour)) %>%
ggplot(.,aes(year,sum_counted_hour))+geom_col()+
xlab("Year")+ylab("Summation of How Many Counted by hour \n(Mean of How many counted by hour)")+
ggtitle("Total of How many counted by hour")+
scale_y_continuous(expand=c(0,750))+
geom_text(aes(label=round(sum_counted_hour,2)),size=3.5,vjust=-0.5)+
geom_text(aes(label=round(mean_counted_hour,2)),vjust=1)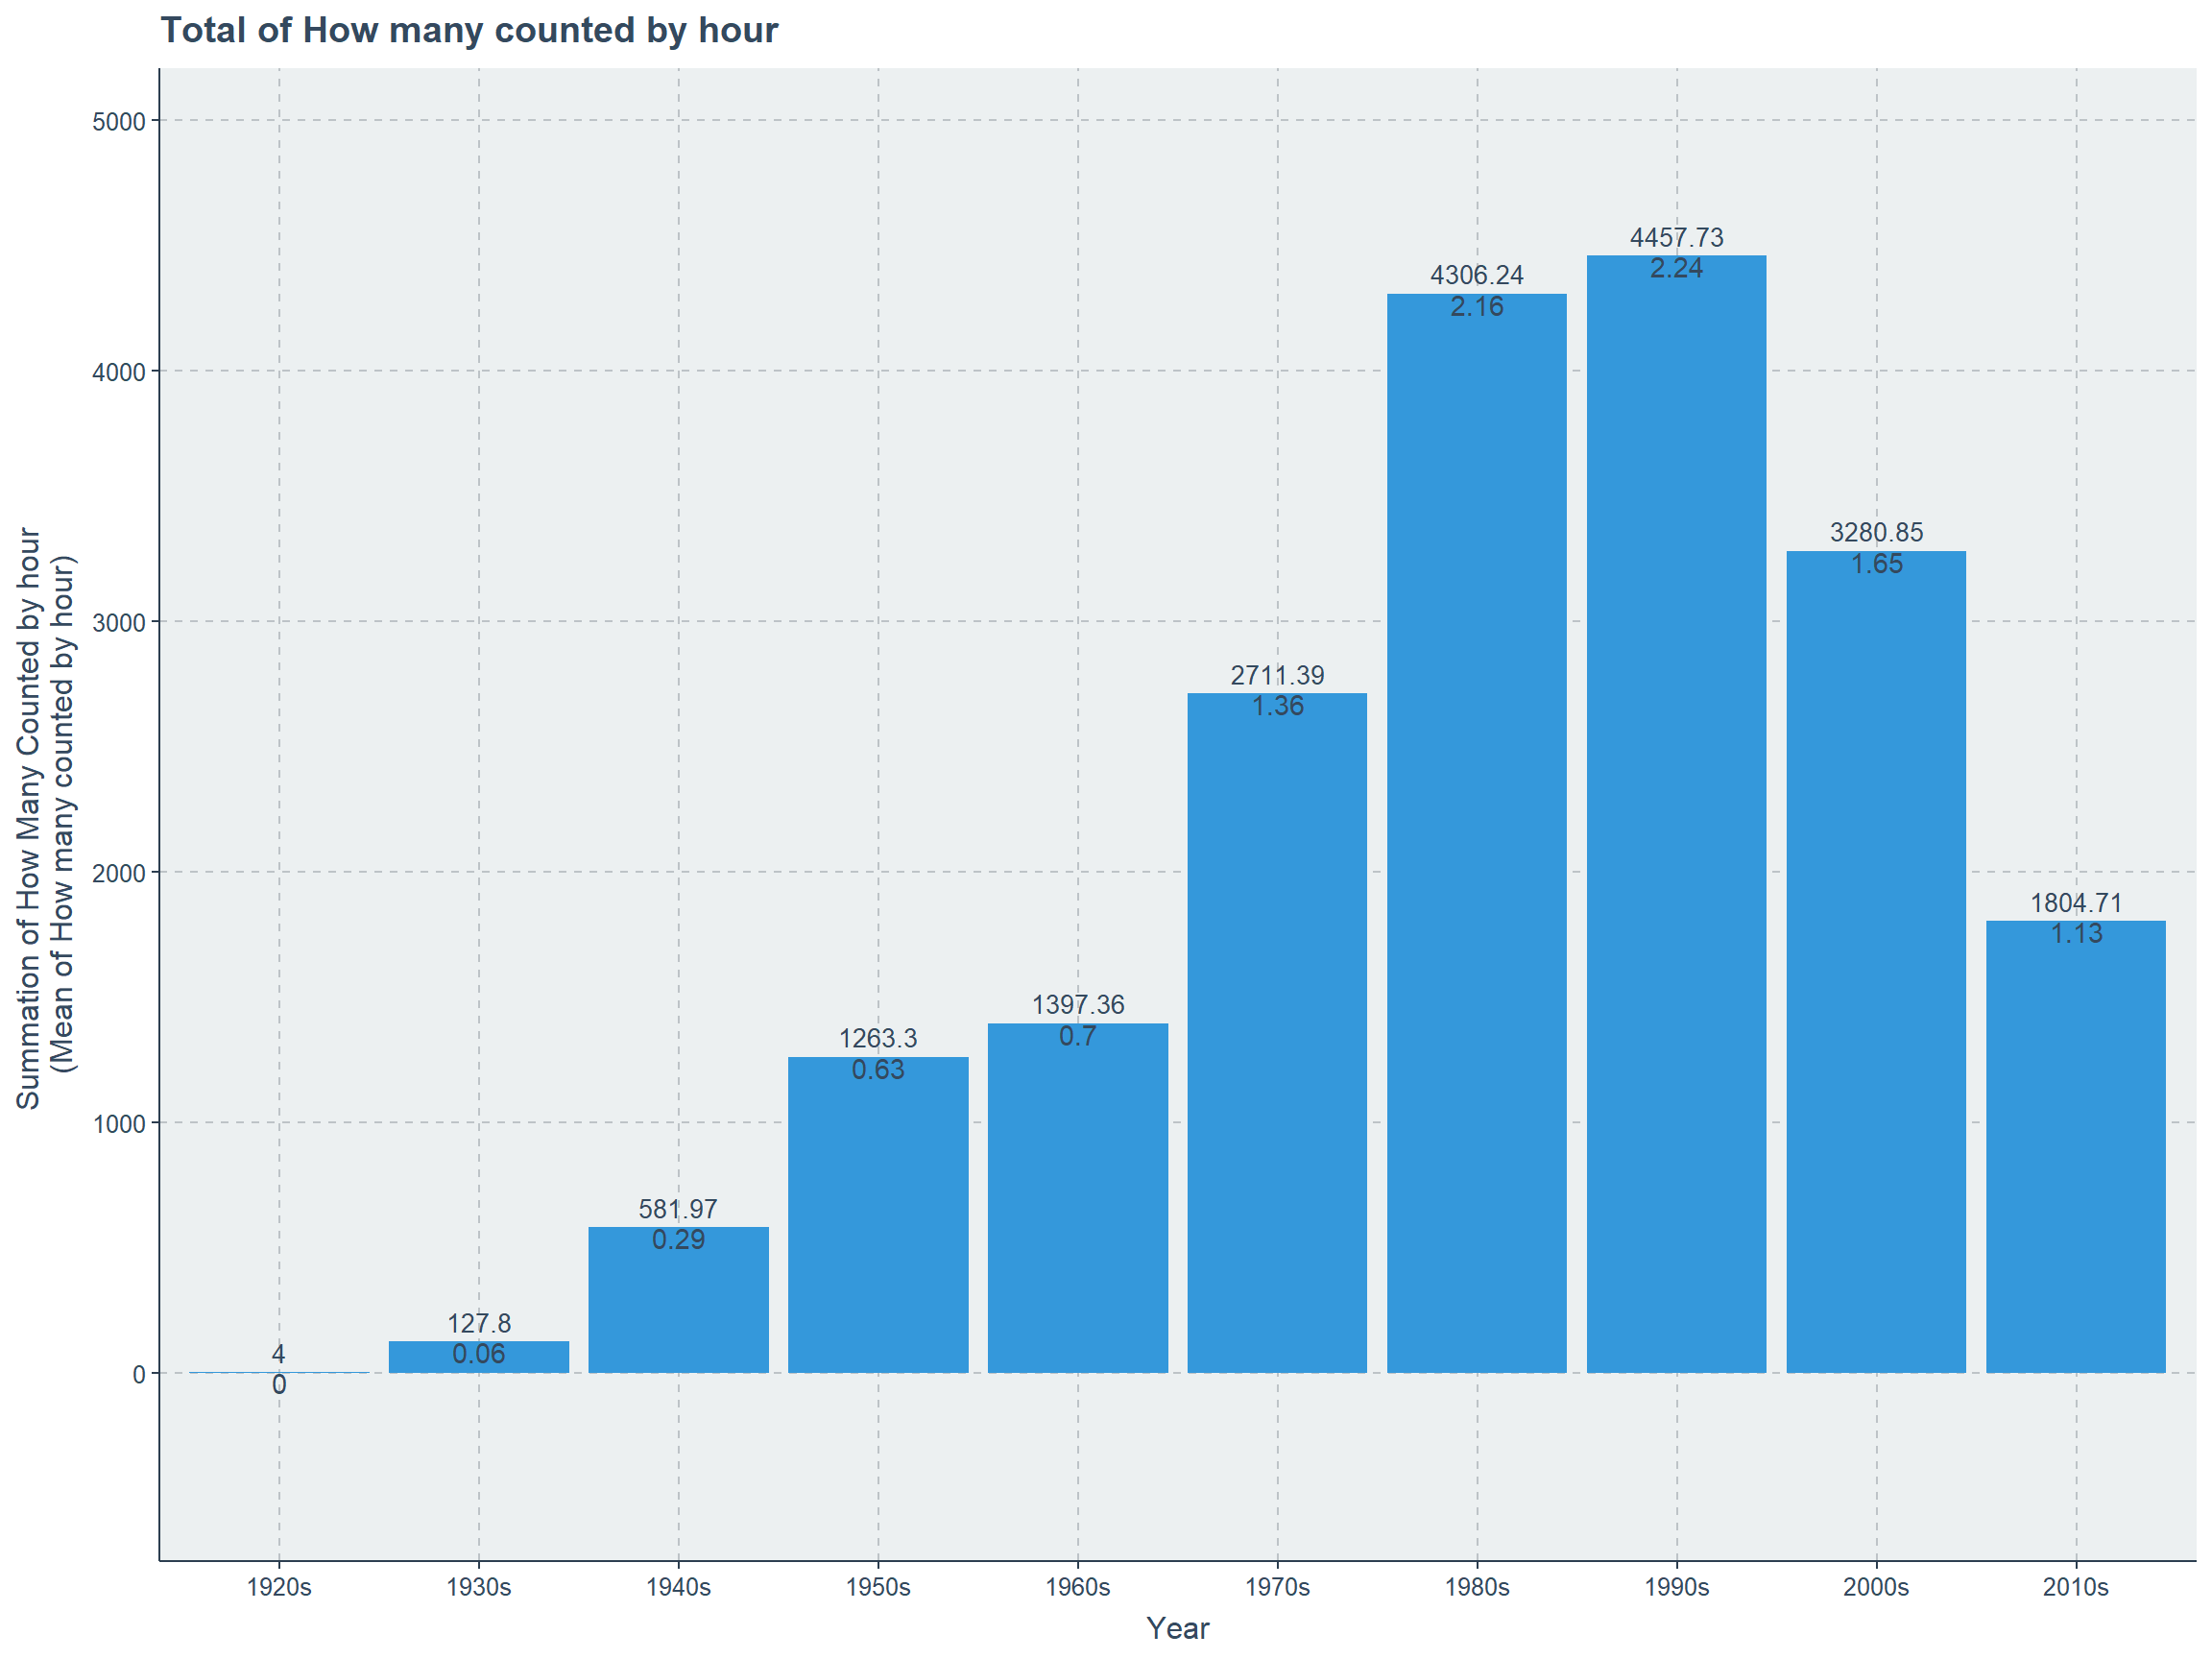
Top 10 Species with how many counted
bird_counts_new %>%
replace_na(list(how_many_counted = 0)) %>%
group_by(species) %>%
summarise(sum_counted=sum(how_many_counted)) %>%
top_n(10) %>%
ggplot(.,aes(str_wrap(species,12),sum_counted))+geom_col()+
xlab("Year")+ylab("Summation of How Many Counted")+
ggtitle("Total of How many counted")+
geom_text(aes(label=sum_counted),size=3.5,vjust=0.5)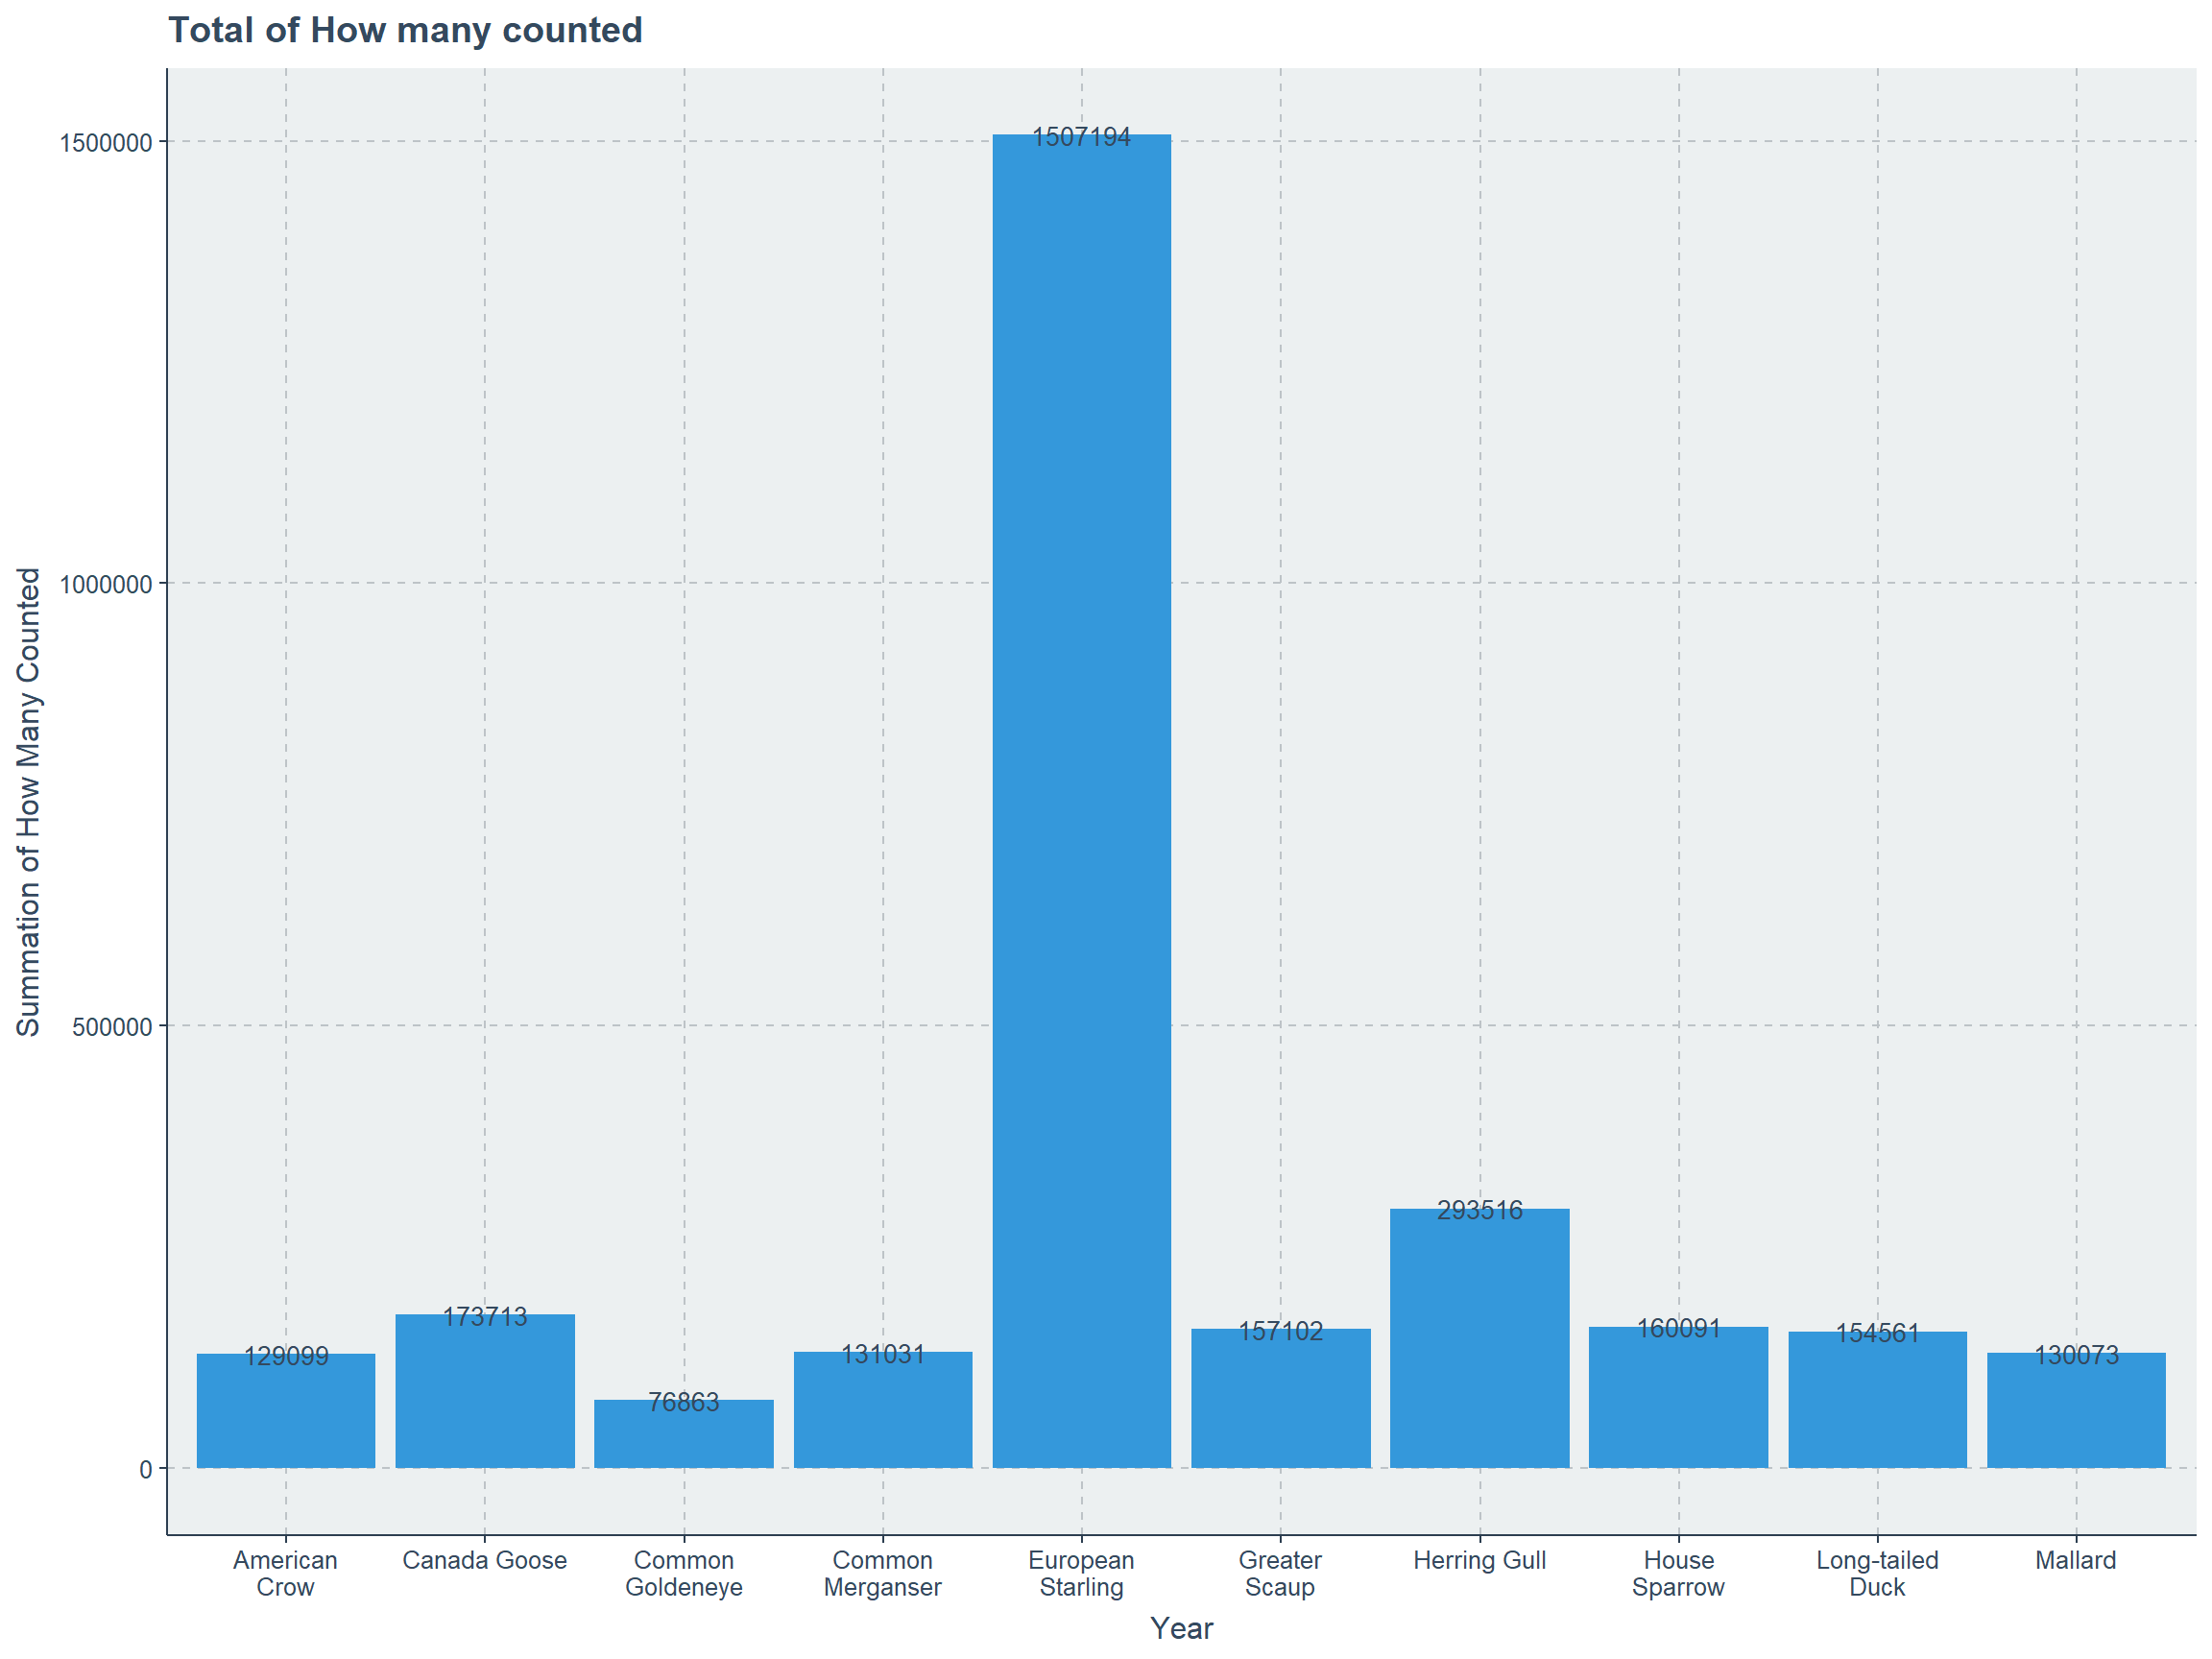
Top 10 Species with how many counted by year
p1<-bird_counts%>%
subset(species=="American Crow" | species=="Canada Goose" |
species=="Common Goldeneye" | species=="Common Merganser" |
species=="European Starling" | species=="Greater Scaup" |
species=="Herring Gull" | species=="House Sparrow" |
species=="Long-tailed Duck" | species=="Mallard") %>%
replace_na(list(how_many_counted = 0)) %>%
group_by(year,species) %>%
ggplot(.,aes(str_wrap(species,12),how_many_counted))+geom_col()+
xlab("Year")+ylab("How Many Counted")+
ggtitle("How many counted for Top 10 Species",
subtitle ="Year:{round(frame_time)}" )+
transition_time(year)+ease_aes("linear")+
geom_text(aes(label=how_many_counted),size=3.5,vjust=0.5)
animate(p1,nframes=94,fps=1)
Top 10 Species with how many counted by decade
bird_counts_new%>%
subset(species=="American Crow" | species=="Canada Goose" |
species=="Common Goldeneye" | species=="Common Merganser" |
species=="European Starling" | species=="Greater Scaup" |
species=="Herring Gull" | species=="House Sparrow" |
species=="Long-tailed Duck" | species=="Mallard") %>%
replace_na(list(how_many_counted = 0)) %>%
group_by(year,species) %>%
summarise(hmc=sum(how_many_counted)) %>%
ggplot(.,aes(str_wrap(species,12),hmc))+geom_col()+
xlab("Year")+ylab("How Many Counted")+
ggtitle("How many counted for Top 10 Species",
subtitle ="Decade:{closest_state}" )+
transition_states(year)+ease_aes("linear")+
geom_text(aes(label=hmc),size=3.5,vjust=0.5)
Top 10 How many counted by hours
bird_counts_new %>%
replace_na(list(how_many_counted_by_hour = 0)) %>%
group_by(species) %>%
summarise(sum_counted=sum(how_many_counted_by_hour)) %>%
top_n(10) %>%
ggplot(.,aes(str_wrap(species,12),sum_counted))+geom_col()+
xlab("Year")+ylab("Summation of How Many Counted by Hour")+
ggtitle("Total of How many counted by Hour")+
geom_text(aes(label=round(sum_counted,2)),size=3.5,vjust=0.5)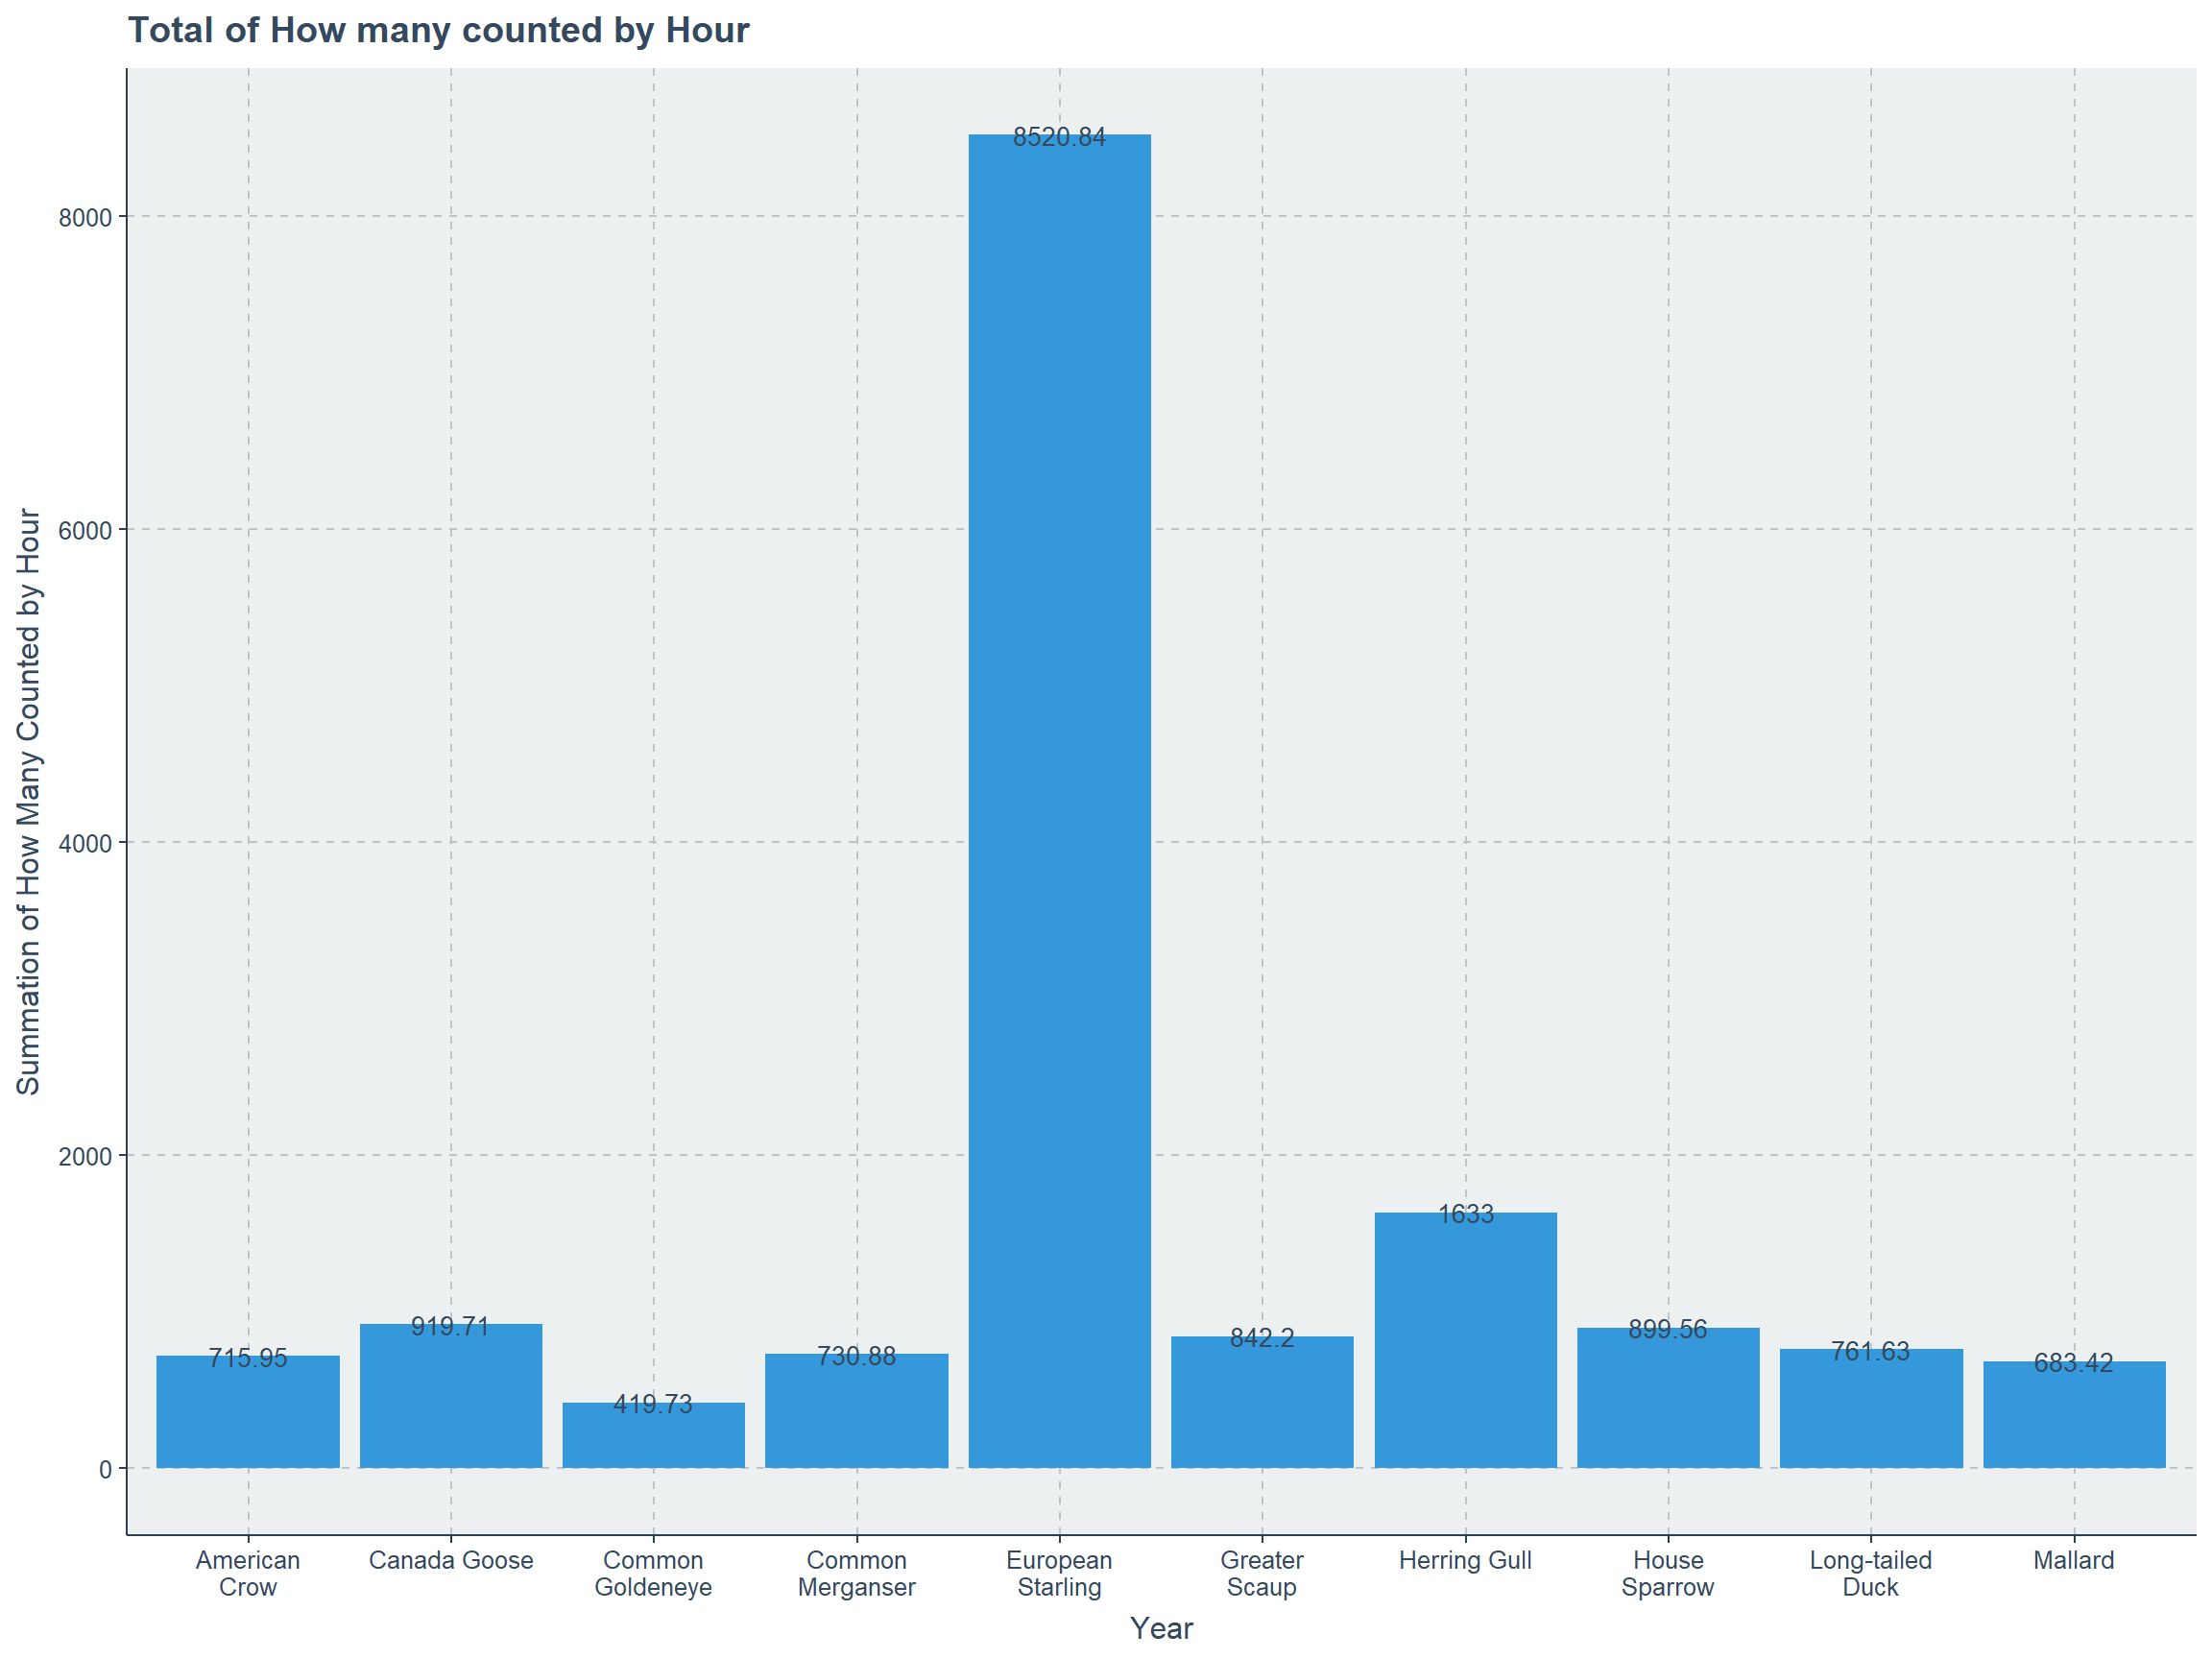
Top 10 Species with how many counted by hours for year
p1<-bird_counts%>%
subset(species=="American Crow" | species=="Canada Goose" |
species=="Common Goldeneye" | species=="Common Merganser" |
species=="European Starling" | species=="Greater Scaup" |
species=="Herring Gull" | species=="House Sparrow" |
species=="Long-tailed Duck" | species=="Mallard") %>%
replace_na(list(how_many_counted_by_hour = 0)) %>%
group_by(year,species) %>%
ggplot(.,aes(str_wrap(species,12),how_many_counted_by_hour))+geom_col()+
xlab("Year")+ylab("How Many Counted by Hour")+
ggtitle("How many counted by Hour for Top 10 Species",
subtitle ="Year:{round(frame_time)}" )+
transition_time(year)+ease_aes("linear")+
geom_text(aes(label=round(how_many_counted_by_hour,2)),size=3.5,vjust=0.5)
animate(p1,nframes=94,fps=1)
Top 10 Species with how many counted by hours for decade
bird_counts_new%>%
subset(species=="American Crow" | species=="Canada Goose" |
species=="Common Goldeneye" | species=="Common Merganser" |
species=="European Starling" | species=="Greater Scaup" |
species=="Herring Gull" | species=="House Sparrow" |
species=="Long-tailed Duck" | species=="Mallard") %>%
replace_na(list(how_many_counted_by_hour = 0)) %>%
group_by(year,species) %>%
summarise(hmc=sum(how_many_counted)) %>%
ggplot(.,aes(str_wrap(species,12),hmc))+geom_col()+
xlab("Year")+ylab("How Many Counted")+
ggtitle("How many counted for Top 10 Species",
subtitle ="Decade:{closest_state}" )+
transition_states(year)+ease_aes("linear")+
geom_text(aes(label=round(hmc,2)),size=3.5,vjust=0.5)
THANK YOU