

- Crossing vs Direction with Morning or Evening for Everyday
- Averag Bike Count in Different Time Laps
- Pedestrian Count With Different Time Laps
- Monthly Pedestrian Count for Everyday with AM or PM when TRUE
- Monthly Pedestrian Count for Everyday with AM or PM when FALSE
- Day by Pedestrian Count for Everyday with AM or PM when TRUE
- Day by Pedestrian Count for Everyday with AM or PM when FALSE
- Hourly Pedestrian Count for Every Month with AM or PM when TRUE
- Hourly Pedestrian Count for Every Month with AM or PM when FALSE
- Average Bike Count with Crossings
- Average Bike Count with Directions
- Average Bike Count with Crossings by Day
- Average Bike Count with Directions by Day
library(tidyverse)
library(dplyr)
library(gganimate)
library(ggthemr)
library(splitstackshape)
library(lubridate)
library(readr)

bike_traffic <- read_csv("bike_traffic.csv")

#bike_traffic <- readr::read_csv("https://raw.githubusercontent.com/rfordatascience/tidytuesday/master/data/2019/2019-04-02/bike_traffic.csv")blogdown::shortcode("tweet","1113036696214495232")Burke Gilman Trail, Elliot Bay Trail and MTS Trail are crossings having a higher average count of bikes than others over the Years while plotting them under days of a week. #TidyTuesday pic.twitter.com/wCj6PLv8DM
— Amalan Mahendran (@Amalan_Con_Stat) April 2, 2019
Crossing vs Direction with Morning or Evening for Everyday
p<-bike_traffic %>%
      cSplit("date",sep=" ") %>%
      rename("DMY"="date_1") %>%
      rename("HMS"="date_2") %>%
      rename("MorE"="date_3") %>%
      mutate(DMY=mdy(DMY)) %>%
      mutate(HMS=hms(HMS)) %>%
      select(DMY,MorE,direction,crossing,bike_count) %>%
ggplot(.,aes(x=direction,y=str_wrap(crossing,15),
             color=MorE,size=bike_count))+
      geom_jitter()+
      xlab("Direction")+ylab("Crossing")+
      transition_time(DMY)+ease_aes("linear")+
      ggtitle("Crossing and Direction for Bike Count",
              subtitle = "Date: {frame_time}")

animate(p,nframes=1899,fps=1) 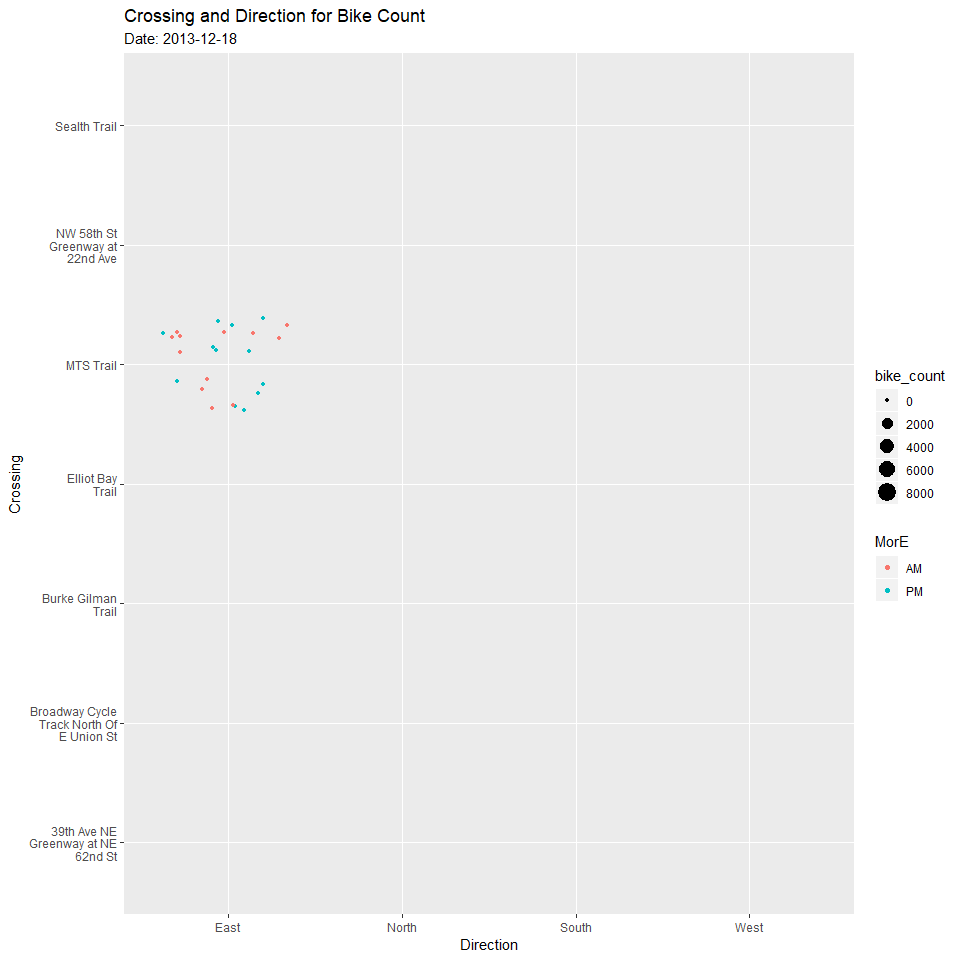
Averag Bike Count in Different Time Laps
Monthly Average Bike Count for Everyday with AM or PM
p<-bike_traffic %>%
      cSplit("date",sep=" ") %>%
      rename("DMY"="date_1") %>%
      rename("HMS"="date_2") %>%
      rename("MorE"="date_3") %>%
      mutate(DMY=mdy(DMY)) %>%
      mutate(Year=year(DMY)) %>%
      mutate(Month=month(DMY)) %>%
      mutate(Day=day(DMY)) %>%
      group_by(MorE,Year,Month,Day) %>%
      summarise(Average=mean(bike_count,na.rm = TRUE)) %>%
ggplot(.,aes(y=Average,x=factor(Month),color=MorE))+
      geom_jitter()+transition_time(Year)+
      ease_aes("linear")+
      scale_y_continuous(labels=seq(0,175,5),breaks=seq(0,175,5))+
      xlab("Month")+ylab("Average Bike Count")+
      ggtitle("Average Bike Count changing with Time",
              subtitle = "Year : {frame_time}")

animate(p,nframes=7,fps=1) 
Day by Average Bike Count for Everyday with AM or PM
p<-bike_traffic %>%
      cSplit("date",sep=" ") %>%
      rename("DMY"="date_1") %>%
      rename("HMS"="date_2") %>%
      rename("MorE"="date_3") %>%
      mutate(DMY=mdy(DMY)) %>%
      mutate(HMS=hms(HMS)) %>%
      mutate(Day=day(DMY)) %>%
      mutate(Year=year(DMY)) %>%
      mutate(Month=month(DMY)) %>%
      group_by(MorE,Year,Month,Day) %>%
      summarise(Average=mean(bike_count,na.rm = TRUE)) %>%
ggplot(.,aes(y=Average,x=factor(Day),color=MorE))+
      geom_jitter()+transition_time(Year)+
      ease_aes("linear")+coord_flip()+
      scale_y_continuous(labels=seq(0,170,10),breaks=seq(0,170,10))+
      xlab("Day")+ylab("Average Bike Count")+
      ggtitle("Average Bike Count changing with Time",
              subtitle = "Year : {frame_time}")

animate(p,nframes=7,fps=1) 
Hourly Average Bike Count for Every Month with AM or PM
p<-bike_traffic %>%
      cSplit("date",sep=" ") %>%
      rename("DMY"="date_1") %>%
      rename("HMS"="date_2") %>%
      rename("MorE"="date_3") %>%
      mutate(DMY=mdy(DMY)) %>%
      mutate(HMS=hms(HMS)) %>%
      mutate(Hour=hour(HMS)) %>%
      mutate(Year=year(DMY)) %>%
      mutate(Month=month(DMY)) %>%
      group_by(MorE,Year,Month,Hour) %>%
      summarise(Average=mean(bike_count,na.rm = TRUE)) %>%
ggplot(.,aes(y=Average,x=factor(Hour),color=MorE))+
      geom_jitter()+transition_time(Year)+
      ease_aes("linear")+
      xlab("Hour")+ylab("Average Bike Count")+
      scale_y_continuous(labels=seq(0,55,5),breaks=seq(0,55,5))+
      ggtitle("Average Bike Count changing with Time",
              subtitle = "Year : {frame_time}")

animate(p,nframes=7,fps=1) 
Pedestrian Count With Different Time Laps
Monthly Pedestrian Count for Everyday with AM or PM when TRUE
p<-bike_traffic %>%
      cSplit("date",sep=" ") %>%
      rename("DMY"="date_1") %>%
      rename("HMS"="date_2") %>%
      rename("MorE"="date_3") %>%
      mutate(DMY=mdy(DMY)) %>%
      mutate(Year=year(DMY)) %>%
      mutate(Month=month(DMY)) %>%
      mutate(Day=day(DMY)) %>%
      group_by(MorE,Year,Month,Day) %>%
      subset(ped_count==TRUE) %>%
      summarise(Average=summary.factor(ped_count)) %>%
ggplot(.,aes(y=Average,x=factor(Month),color=MorE))+
      geom_jitter()+transition_time(Year)+
      ease_aes("linear")+
      xlab("Month")+ylab("Pedestrian Count")+
      scale_y_continuous(labels=seq(0,22.5,2.5),breaks=seq(0,22.5,2.5))+
      ggtitle("Pedestrian Count changing with Time",
              subtitle = "Year : {frame_time}")

animate(p,nframes=7,fps=1) 
Monthly Pedestrian Count for Everyday with AM or PM when FALSE
p<-bike_traffic %>%
      cSplit("date",sep=" ") %>%
      rename("DMY"="date_1") %>%
      rename("HMS"="date_2") %>%
      rename("MorE"="date_3") %>%
      mutate(DMY=mdy(DMY)) %>%
      mutate(Year=year(DMY)) %>%
      mutate(Month=month(DMY)) %>%
      mutate(Day=day(DMY)) %>%
      group_by(MorE,Year,Month,Day) %>%
      subset(ped_count==FALSE) %>%
      summarise(Average=summary.factor(ped_count)) %>%
ggplot(.,aes(y=Average,x=factor(Month),color=MorE))+
      geom_jitter()+transition_time(Year)+
      ease_aes("linear")+
      xlab("Month")+ylab("Pedestrian Count")+
      scale_y_continuous(labels=seq(0,75,5),breaks=seq(0,75,5))+
      ggtitle("Pedestrian Count changing with Time",
              subtitle = "Year : {frame_time}")

animate(p,nframes=7,fps=1) 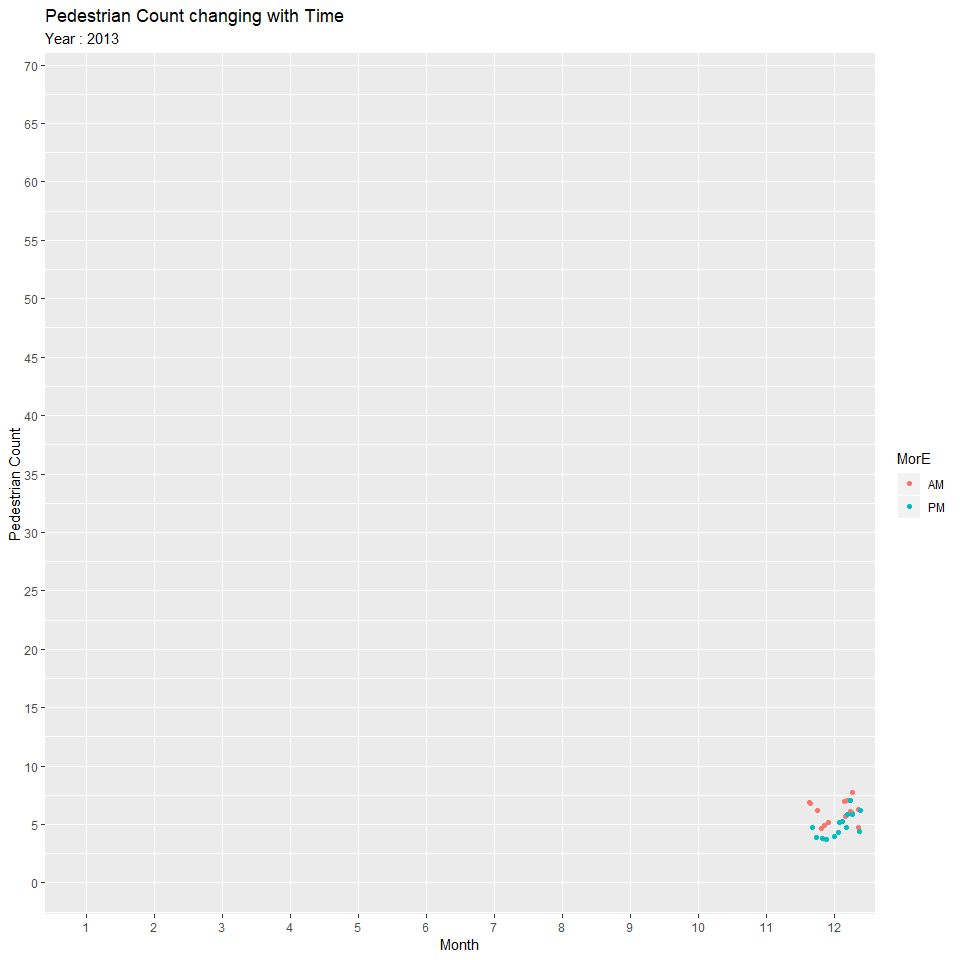
Day by Pedestrian Count for Everyday with AM or PM when TRUE
p<-bike_traffic %>%
      cSplit("date",sep=" ") %>%
      rename("DMY"="date_1") %>%
      rename("HMS"="date_2") %>%
      rename("MorE"="date_3") %>%
      mutate(DMY=mdy(DMY)) %>%
      mutate(HMS=hms(HMS)) %>%
      mutate(Day=day(DMY)) %>%
      mutate(Year=year(DMY)) %>%
      mutate(Month=month(DMY)) %>%
      group_by(MorE,Year,Month,Day) %>%
      subset(ped_count==TRUE) %>%
      summarise(Average=summary.factor(ped_count)) %>%
ggplot(.,aes(y=Average,x=factor(Day),color=MorE))+
      geom_jitter()+transition_time(Year)+
      ease_aes("linear")+coord_flip()+
      xlab("Day")+ylab("Pedestrian Count")+
      scale_y_continuous(labels=seq(0,22.5,2.5),breaks=seq(0,22.5,2.5))+
      ggtitle("Pedestrian Count changing with Time",
              subtitle = "Year : {frame_time}")

animate(p,nframes=7,fps=1) 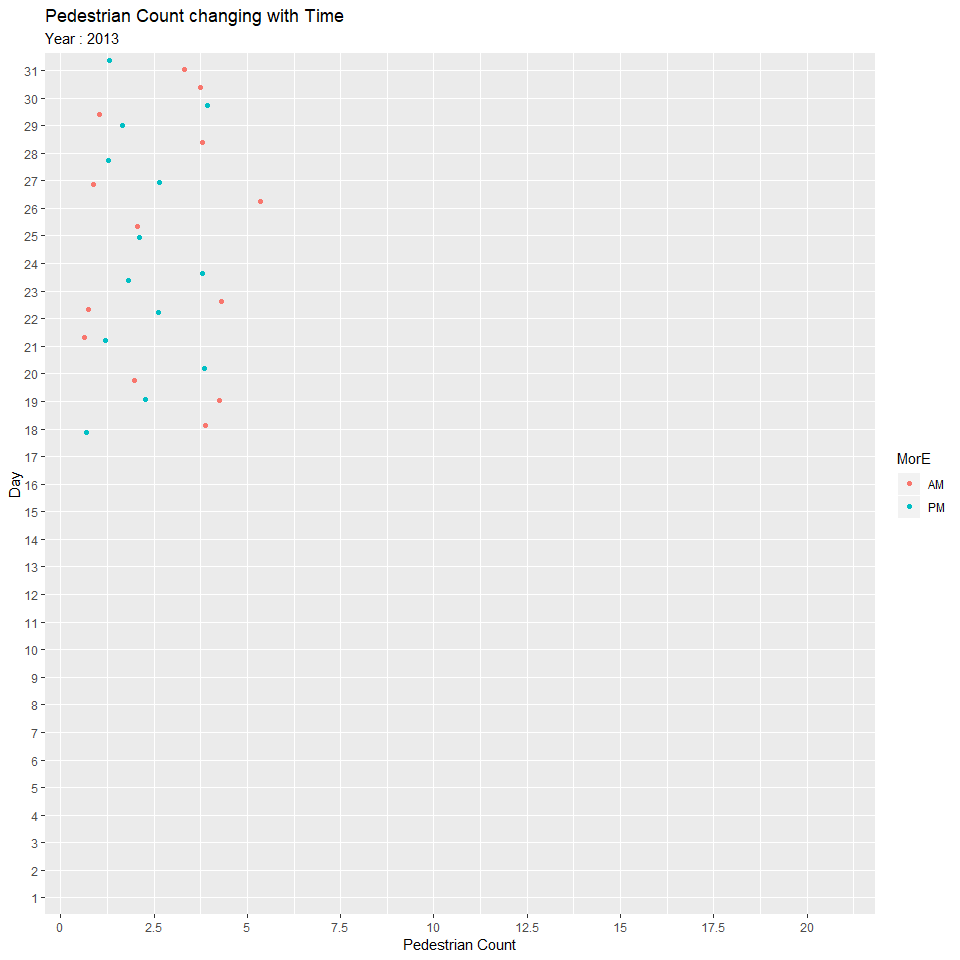
Day by Pedestrian Count for Everyday with AM or PM when FALSE
p<-bike_traffic %>%
      cSplit("date",sep=" ") %>%
      rename("DMY"="date_1") %>%
      rename("HMS"="date_2") %>%
      rename("MorE"="date_3") %>%
      mutate(DMY=mdy(DMY)) %>%
      mutate(HMS=hms(HMS)) %>%
      mutate(Day=day(DMY)) %>%
      mutate(Year=year(DMY)) %>%
      mutate(Month=month(DMY)) %>%
      group_by(MorE,Year,Month,Day) %>%
      subset(ped_count==FALSE) %>%
      summarise(Average=summary.factor(ped_count)) %>%
ggplot(.,aes(y=Average,x=factor(Day),color=MorE))+
      geom_jitter()+transition_time(Year)+
      ease_aes("linear")+coord_flip()+
      xlab("Day")+ylab("Pedestrian Count")+
      scale_y_continuous(labels=seq(0,70,5),breaks=seq(0,70,5))+
      ggtitle("Pedestrian Count changing with Time",
              subtitle = "Year : {frame_time}")

animate(p,nframes=7,fps=1) 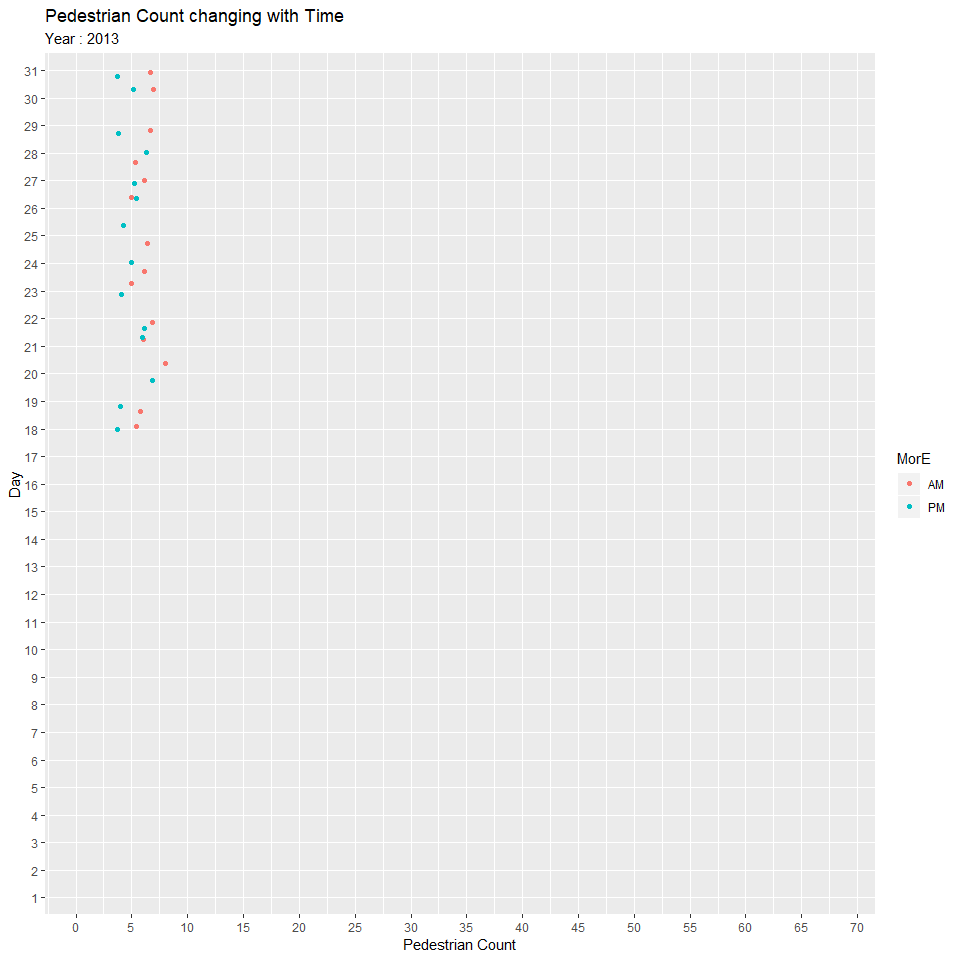
Hourly Pedestrian Count for Every Month with AM or PM when TRUE
p<-bike_traffic %>%
      cSplit("date",sep=" ") %>%
      rename("DMY"="date_1") %>%
      rename("HMS"="date_2") %>%
      rename("MorE"="date_3") %>%
      mutate(DMY=mdy(DMY)) %>%
      mutate(HMS=hms(HMS)) %>%
      mutate(Hour=hour(HMS)) %>%
      mutate(Year=year(DMY)) %>%
      mutate(Month=month(DMY)) %>%
      group_by(MorE,Year,Month,Hour) %>%
      subset(ped_count==TRUE) %>%
      summarise(Average=summary.factor(ped_count)) %>%
ggplot(.,aes(y=Average,x=factor(Hour),color=MorE))+
      geom_jitter()+transition_time(Year)+
      ease_aes("linear")+
      xlab("Hour")+ylab("Pedestrian Count")+
      scale_y_continuous(labels=seq(0,60,5),breaks=seq(0,60,5))+
      ggtitle("Pedestrian Count changing with Time",
              subtitle = "Year : {frame_time}")

animate(p,nframes=7,fps=1) 
Hourly Pedestrian Count for Every Month with AM or PM when FALSE
p<-bike_traffic %>%
      cSplit("date",sep=" ") %>%
      rename("DMY"="date_1") %>%
      rename("HMS"="date_2") %>%
      rename("MorE"="date_3") %>%
      mutate(DMY=mdy(DMY)) %>%
      mutate(HMS=hms(HMS)) %>%
      mutate(Hour=hour(HMS)) %>%
      mutate(Year=year(DMY)) %>%
      mutate(Month=month(DMY)) %>%
      group_by(MorE,Year,Month,Hour) %>%
      subset(ped_count==TRUE) %>%
      summarise(Average=summary.factor(ped_count)) %>%
ggplot(.,aes(y=Average,x=factor(Hour),color=MorE))+
      geom_jitter()+transition_time(Year)+
      ease_aes("linear")+
      xlab("Hour")+ylab("Pedestrian Count")+
      scale_y_continuous(labels=seq(0,60,5),breaks=seq(0,60,5))+
      ggtitle("Pedestrian Count changing with Time",
              subtitle = "Year : {frame_time}")

animate(p,nframes=7,fps=1) 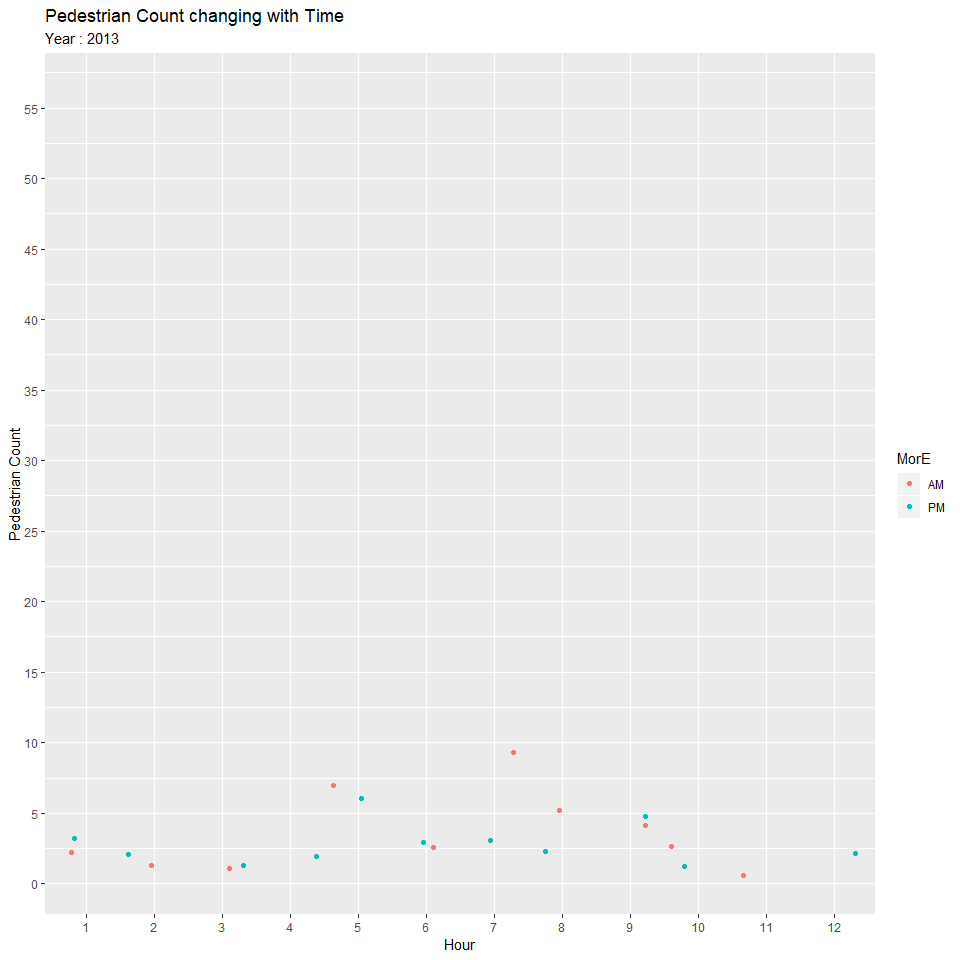
Average Bike Count with Crossings
p<-bike_traffic %>%
      cSplit("date",sep=" ") %>%
      rename("DMY"="date_1") %>%
      rename("HMS"="date_2") %>%
      rename("MorE"="date_3") %>%
      mutate(DMY=mdy(DMY)) %>%
      mutate(HMS=hms(HMS)) %>%
      mutate(Year=year(DMY)) %>%
      mutate(Month=month(DMY)) %>%
      group_by(MorE,Year,Month,crossing) %>%
      summarise(Average=mean(bike_count)) %>%
ggplot(.,aes(y=Average,x=str_wrap(crossing,8),
             color=Month,shape=MorE))+
      geom_jitter()+transition_time(Year)+
      ease_aes("linear")+
      xlab("Crossing")+ylab("Average Bike Count")+
      ggtitle("Average Bike Count changing with Time",
              subtitle = "Year : {frame_time}")

animate(p,nframes=7,fps=1) 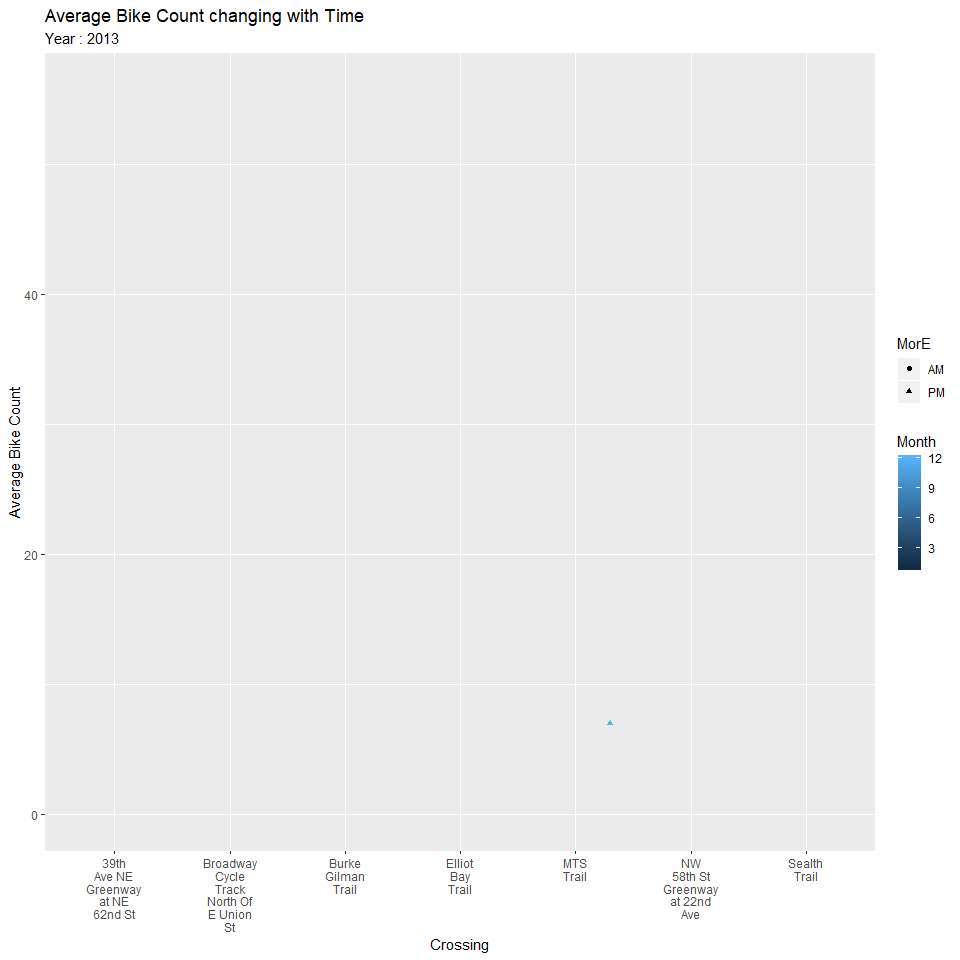
Average Bike Count with Directions
p<-bike_traffic %>%
      cSplit("date",sep=" ") %>%
      rename("DMY"="date_1") %>%
      rename("HMS"="date_2") %>%
      rename("MorE"="date_3") %>%
      mutate(DMY=mdy(DMY)) %>%
      mutate(HMS=hms(HMS)) %>%
      mutate(Year=year(DMY)) %>%
      mutate(Month=month(DMY)) %>%
      group_by(MorE,Year,Month,direction) %>%
      summarise(Average=mean(bike_count)) %>%
ggplot(.,aes(y=Average,x=str_wrap(direction,10),
             color=Month,shape=MorE))+
      geom_jitter()+transition_time(Year)+
      ease_aes("linear")+
      xlab("Direction")+ylab("Average Bike Count")+
      ggtitle("Average Bike Count changing with Time",
              subtitle = "Year : {frame_time}")

animate(p,nframes=7,fps=1) 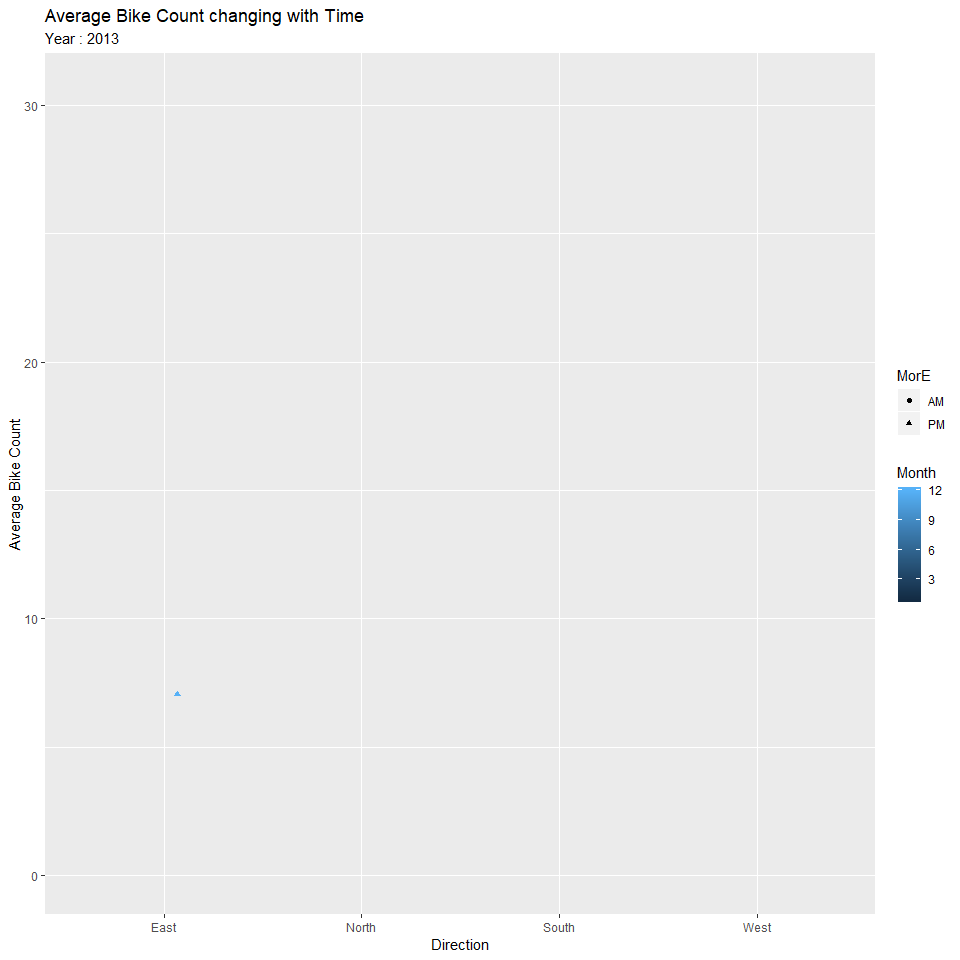
Average Bike Count with Crossings by Day
p<-bike_traffic %>%
      cSplit("date",sep=" ") %>%
      rename("DMY"="date_1") %>%
      rename("HMS"="date_2") %>%
      rename("MorE"="date_3") %>%
      mutate(DMY=mdy(DMY)) %>%
      mutate(HMS=hms(HMS)) %>%
      mutate(Year=year(DMY)) %>%
      mutate(Month=month(DMY)) %>%
      mutate(Wday=wday(DMY,label=TRUE)) %>%
      group_by(Year,Month,Wday,crossing) %>%
      summarise(Average=mean(bike_count)) %>%
ggplot(.,aes(y=Average,x=Wday,color=Month))+
      geom_jitter()+transition_time(Year)+
      theme(legend.position = "bottom",axis.text.x = element_text(hjust=1,angle = 45))+
      ease_aes("linear")+facet_grid(~str_wrap(crossing,10))+
      xlab("Day of the week")+ylab("Average Bike Count")+
      ggtitle("Average Bike Count changing with Time",
              subtitle = "Year : {frame_time}")

animate(p,nframes=7,fps=1) 
Average Bike Count with Directions by Day
p<-bike_traffic %>%
      cSplit("date",sep=" ") %>%
      rename("DMY"="date_1") %>%
      rename("HMS"="date_2") %>%
      rename("MorE"="date_3") %>%
      mutate(DMY=mdy(DMY)) %>%
      mutate(HMS=hms(HMS)) %>%
      mutate(Year=year(DMY)) %>%
      mutate(Month=month(DMY)) %>%
      mutate(Wday=wday(DMY,label=TRUE)) %>%
      group_by(Year,Month,Wday,direction) %>%
      summarise(Average=mean(bike_count)) %>%
ggplot(.,aes(y=Average,x=Wday,color=Month))+
      geom_jitter()+transition_time(Year)+
      theme(legend.position = "bottom")+
      ease_aes("linear")+facet_grid(~direction)+
      xlab("Day of the Week")+ylab("Average Bike Count")+
      ggtitle("Average Bike Count changing with Time",
              subtitle = "Year : {frame_time}")

animate(p,nframes=7,fps=1) 
THANK YOU