# Load the packges
library(ggplot2)
library(ggthemr)
library(stringr)
library(gridExtra)
library(tidyverse)
library(tweenr)
library(gganimate)
library(kableExtra)
library(magrittr)
library(knitr)
library(readr)

#load the data
Thanksgiving<-read_csv("thanksgiving_meals.csv")

# apply the theme grape
ggthemr("grape")

#subset the people who said yes for celebrating thanksgiving
Thanksgiving_Yes<-subset(Thanksgiving,celebrate=="Yes")

#subset the people who said no for celebrating thanksgiving
Thanksgiving_No<-subset(Thanksgiving,celebrate=="No")
Data set was provided on week 34 for TidyTuesday analysis. As it is Thanksgiving week this is understandable. You can receive the data set here. There are more than 65 variables and 1058 observations. The data was acquired buy a survey conducted online and information about them are here.
My take on Thanksgiving, Praying and Celebrating based on US regions from this data set. #Tidytuesday https://t.co/dhCJEYWOlO pic.twitter.com/4Kij5PF4oV
— Amalan Mahendran (@Amalan_Con_Stat) November 22, 2018
People who do and do not celebrate Thanksgiving
In this ThanksGiving data set 980 are celebrating, and 78 are not celebrating Thanksgiving. I will use plots to understand their composition and tables to explain them further.
Variables in consideration for this task is none other than Age, Gender, Family Income and US regions. Finally my aim is to create animated plots and interactive tables for the above variables through the help of packages gganimate and kable.
Age Distribution
First the age distribution has only 4 groups, where people who celebrate Thanksgiving in the age category of 18-29 is the very least. Highest count goes to the age category of 45-59 with 269. There are 33 missing observations and they were removed.
Considering the people who do not celebrate Thanksgiving the least count of 6 goes to category of 60+, but here the category of 18-29 has the highest count of 31. No missing observations were recorded here.
Below is an animated bar plot where the counts change for their respective 4 categories. As 90% of respondents have answered Yes for celebrating Thanksgiving and rest have answered No we can clearly see the count differences
attach(Thanksgiving_Yes)
attach(Thanksgiving_No)
# people who do not celebrate
dont_age<-as.data.frame(summary.factor(Thanksgiving_No$age))
# people who do celebrate
do_age<-as.data.frame(summary.factor(na.omit(Thanksgiving_Yes$age)))
# people who do celebrate
data_do_age<-data.frame(group=c("18-29","30-44","45-59","60+"),
                      values=do_age$`summary.factor(na.omit(Thanksgiving_Yes$age))`,
                        frame=rep("Do Celebrate",4))
# people who do not celebrate
data_dont_age<-data.frame(group=c("18-29","30-44","45-59","60+"),
                          values=dont_age$`summary.factor(Thanksgiving_No$age)`,
                          frame=rep("Do not Celebrate",4))
# combining both
data_age<-rbind(data_do_age,data_dont_age)

# animated bar plot for people who do celebrate and who do not celebrate
ggplot(data_age,aes(x=factor(group),values))+
  geom_bar(stat = 'identity',position = "identity")+
  ylab("Frequency")+xlab("Age Group")+
  ggtitle("Animated plot how Do and Do not people prefer \naccording to Age")+
  geom_text(aes(label=values), vjust=1)+
  transition_states(frame,transition_length = 2,state_length = 3)+
  enter_fade()+
  exit_shrink()+
  ease_aes('cubic-in-out')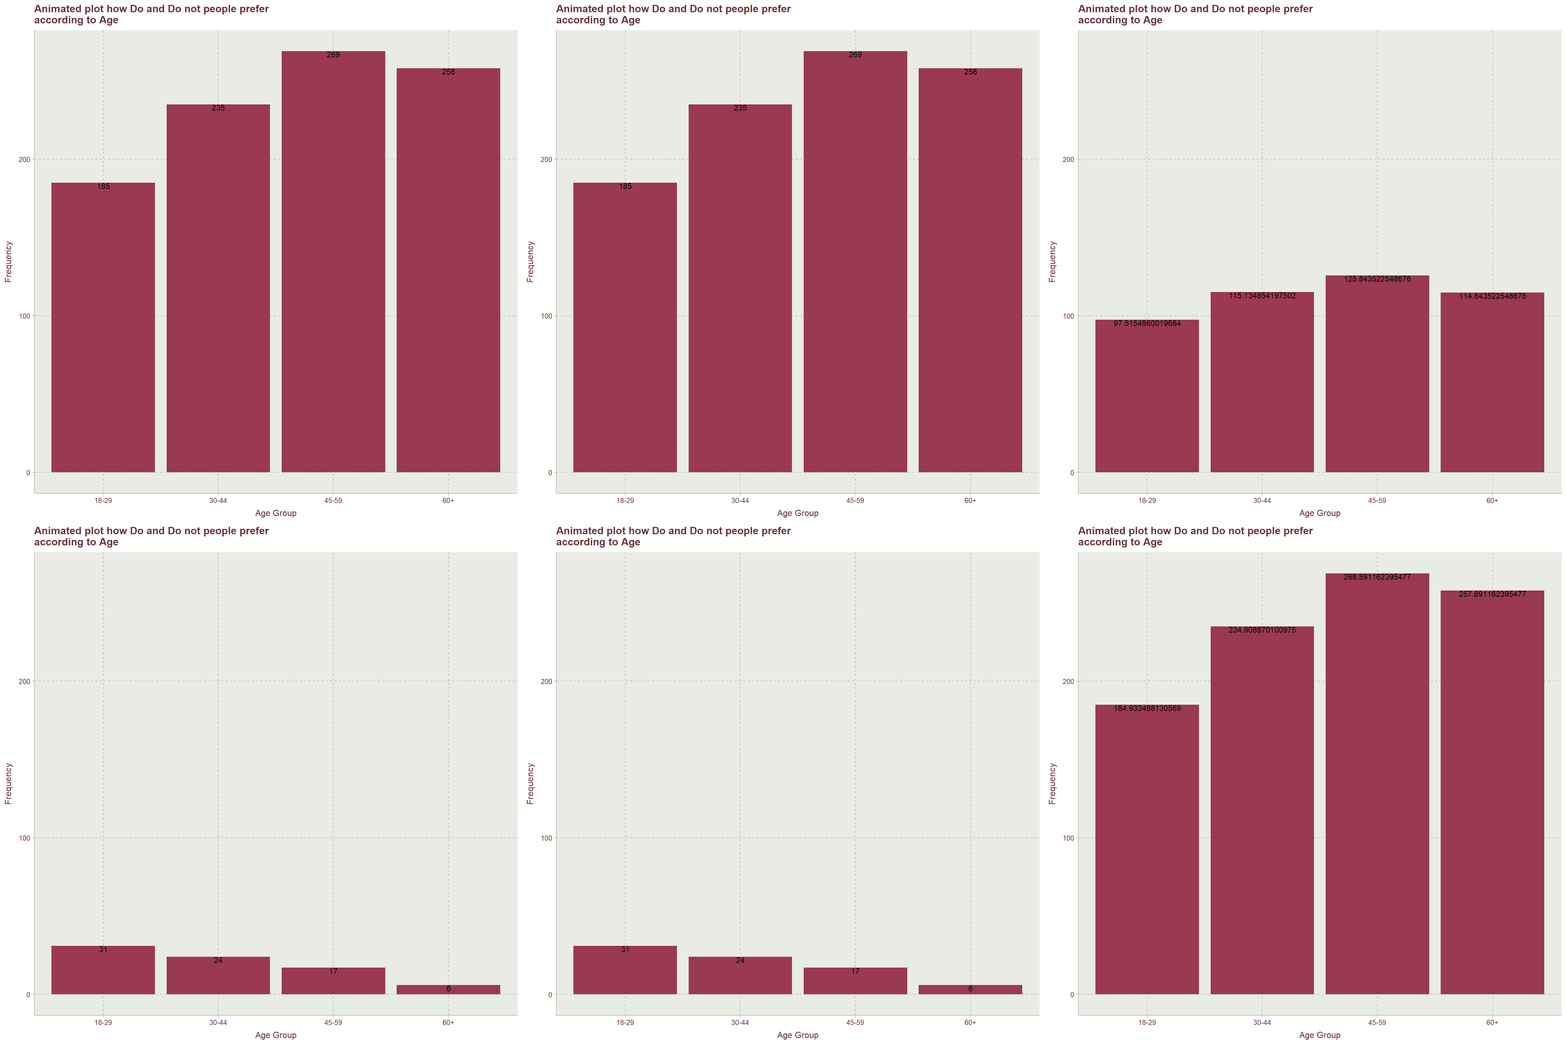
detach(Thanksgiving_Yes)
detach(Thanksgiving_No)
Age with Other Factors
First table is Age vs Gender for people who celebrate Thanksgiving. All age categories have a percentage range in between 19 and 29. Highest percentage of 28.4055 is for Age category 45 - 59. Female have a higher percentage of 54.3823.
Female who are 60+ have the highest percentage of 15.2059, while lowest percentage of 8.7645 is for male in the age category of 18-29.
attach(Thanksgiving_Yes)

#kable(addmargins(table(age,gender))) %>%
#  kable_styling("striped",full_width = F) %>%
#  column_spec(4,bold = T,color = "red") %>%
#  row_spec(5,bold = T,color = "red")

# table of percentages for people who do celebrate
kable(addmargins(round(prop.table(table(age,gender)),6)*100),"html") %>%
  kable_styling("striped",full_width = F) %>%
  column_spec(4,bold = T,color = "red") %>%
  row_spec(5,bold = T,color = "red") %>%
row_spec(0,bold = T,align = 'center')| Female | Male | Sum | |
|---|---|---|---|
| 18 - 29 | 10.7709 | 8.7645 | 19.5354 |
| 30 - 44 | 13.4108 | 11.4044 | 24.8152 |
| 45 - 59 | 14.9947 | 13.4108 | 28.4055 |
| 60+ | 15.2059 | 12.0380 | 27.2439 |
| Sum | 54.3823 | 45.6177 | 100.0000 |
detach(Thanksgiving_Yes)When considering the people who do not celebrate Thanksgiving, highest percentage of 62.8205 is for Male, while age category of 18-29 have the highest percentage of 39.7436.
Male who are in between 18 and 29 have the highest percentage of 25.6410, while Female who are above 60 have the lowest percentage of 2.5641.
attach(Thanksgiving_No)

#kable(addmargins(table(age,gender))) %>%
#  kable_styling("striped",full_width = F) %>%
#  column_spec(4,bold = T,color = "red") %>%
#  row_spec(5,bold = T,color = "red")

# table of percentages for people who do not celebrate
kable(addmargins(round(prop.table(table(age,gender)),6)*100),"html") %>%
  kable_styling("striped",full_width = F) %>%
  column_spec(4,bold = T,color = "red") %>%
  row_spec(5,bold = T,color = "red") %>%
row_spec(0,bold = T,align = 'center')| Female | Male | Sum | |
|---|---|---|---|
| 18 - 29 | 14.1026 | 25.6410 | 39.7436 |
| 30 - 44 | 11.5385 | 19.2308 | 30.7693 |
| 45 - 59 | 8.9744 | 12.8205 | 21.7949 |
| 60+ | 2.5641 | 5.1282 | 7.6923 |
| Sum | 37.1796 | 62.8205 | 100.0001 |
detach(Thanksgiving_No)With relative to people who celebrate Thanksgiving in the Family Income category highest percentage goes to USD 25,000 to 49,999.
People who have Family Income USD 25,000 to 49,999 and age above 60 have the highest percentage of 4.96, while lowest percentage of 0.11 is for people who have Family Income in between USD 175,000 to 199,999 of age category of 18-29.
attach(Thanksgiving_Yes)

#kable(addmargins(table(age,family_income)),"html") %>%
#  kable_styling("striped",full_width = F) %>%
#  column_spec(13,bold = T,color = "red") %>%
#  row_spec(5,bold = T,color = "red")

# table of percentages for people who do celebrate
kable(addmargins(round(prop.table(table(age,family_income)),6)*100),"html") %>%
  kable_styling("striped",full_width = T,font_size = 9) %>%
  column_spec(13,bold = T,color = "red") %>%
  row_spec(5,bold = T,color = "red") %>%
row_spec(0,bold = T,angle = 270,align = 'center')| 9,999 | 24,999 | 124,999 | 149,999 | 174,999 | 199,999 | $200,000 and up | 49,999 | 74,999 | 99,999 | Prefer not to answer | Sum | |
|---|---|---|---|---|---|---|---|---|---|---|---|---|
| 18 - 29 | 3.4847 | 2.1119 | 0.9504 | 0.2112 | 0.5280 | 0.1056 | 0.6336 | 3.6959 | 2.1119 | 2.0063 | 3.6959 | 19.5354 |
| 30 - 44 | 1.3728 | 1.5839 | 2.5343 | 0.8448 | 0.6336 | 0.3168 | 1.2672 | 4.8574 | 4.0127 | 4.2239 | 3.1679 | 24.8153 |
| 45 - 59 | 0.3168 | 1.3728 | 4.1183 | 2.5343 | 2.0063 | 1.1616 | 3.1679 | 4.0127 | 3.1679 | 3.6959 | 2.8511 | 28.4056 |
| 60+ | 0.3168 | 1.2672 | 3.9071 | 1.4784 | 0.8448 | 1.1616 | 2.9567 | 4.9630 | 4.1183 | 3.4847 | 2.7455 | 27.2441 |
| Sum | 5.4911 | 6.3358 | 11.5101 | 5.0687 | 4.0127 | 2.7456 | 8.0254 | 17.5290 | 13.4108 | 13.4108 | 12.4604 | 100.0004 |
detach(Thanksgiving_Yes)Of people who do not celebrate Thanksgiving the Family Income category has the highest percentage which goes to People who prefer not to answer.
15 cells in this table are zero which is the lowest percentage that can occur, while highest percentage goes to people who are in the age category 18 -29 while Family Income is USD 0 to 9,999 and prefer not to answer.
attach(Thanksgiving_No)

#kable(addmargins(table(age,family_income))) %>%
#  kable_styling("striped",full_width = F) %>%
#  column_spec(13,bold = T,color = "red") %>%
#  row_spec(5,bold = T,color = "red")

# table of percentages for people who do not celebrate
kable(addmargins(round(prop.table(table(age,family_income)),6)*100),"html") %>%
  kable_styling("striped",full_width = T,font_size = 9) %>%
  column_spec(13,bold = T,color = "red") %>%
  row_spec(5,bold = T,color = "red") %>%
row_spec(0,bold = T,angle = 270,align = 'center') | 9,999 | 24,999 | 124,999 | 149,999 | 174,999 | 199,999 | $200,000 and up | 49,999 | 74,999 | 99,999 | Prefer not to answer | Sum | |
|---|---|---|---|---|---|---|---|---|---|---|---|---|
| 18 - 29 | 12.8205 | 2.5641 | 1.2821 | 0.0000 | 0.0000 | 0.0000 | 0.0000 | 2.5641 | 5.1282 | 2.5641 | 12.8205 | 39.7436 |
| 30 - 44 | 2.5641 | 3.8462 | 1.2821 | 0.0000 | 1.2821 | 0.0000 | 2.5641 | 8.9744 | 3.8462 | 1.2821 | 5.1282 | 30.7695 |
| 45 - 59 | 2.5641 | 2.5641 | 0.0000 | 1.2821 | 1.2821 | 1.2821 | 2.5641 | 5.1282 | 0.0000 | 3.8462 | 1.2821 | 21.7951 |
| 60+ | 0.0000 | 1.2821 | 0.0000 | 0.0000 | 0.0000 | 0.0000 | 0.0000 | 1.2821 | 1.2821 | 0.0000 | 3.8462 | 7.6925 |
| Sum | 17.9487 | 10.2565 | 2.5642 | 1.2821 | 2.5642 | 1.2821 | 5.1282 | 17.9488 | 10.2565 | 7.6924 | 23.0770 | 100.0007 |
detach(Thanksgiving_No)For the people who celebrate Thanksgiving highest percentage of 21.80 goes to US region of South Atlantic. While lowest percentage goes to Mountain with 4.41.
People who are from South Atlantic in the age categories of 45-59 and 60+ have the highest percentage of 6.55. While the lowest percentage of 0.64 goes to people who are in the age category of 18-29 and from East South Central.
attach(Thanksgiving_Yes)

#kable(addmargins(table(age,us_region))) %>%
#  kable_styling("striped",full_width = F) %>%
#  column_spec(11,bold = T,color = "red") %>%
#  row_spec(5,bold = T,color = "red")

# table of percentages for people who do celebrate
kable(addmargins(round(prop.table(table(age,us_region)),4)*100),"html")  %>%
  kable_styling("striped",full_width = T,font_size = 9) %>%
  column_spec(11,bold = T,color = "red") %>%
  row_spec(5,bold = T,color = "red") %>%
row_spec(0,bold = T,align = 'center')| East North Central | East South Central | Middle Atlantic | Mountain | New England | Pacific | South Atlantic | West North Central | West South Central | Sum | |
|---|---|---|---|---|---|---|---|---|---|---|
| 18 - 29 | 2.79 | 0.64 | 2.26 | 0.75 | 0.97 | 3.11 | 3.76 | 2.26 | 2.47 | 19.01 |
| 30 - 44 | 3.44 | 1.18 | 4.51 | 0.97 | 1.61 | 3.87 | 4.94 | 1.72 | 2.47 | 24.71 |
| 45 - 59 | 4.40 | 2.15 | 4.94 | 1.40 | 1.72 | 3.22 | 6.55 | 1.72 | 2.69 | 28.79 |
| 60+ | 4.94 | 2.04 | 3.87 | 1.29 | 1.61 | 3.76 | 6.55 | 1.93 | 1.50 | 27.49 |
| Sum | 15.57 | 6.01 | 15.58 | 4.41 | 5.91 | 13.96 | 21.80 | 7.63 | 9.13 | 100.00 |
detach(Thanksgiving_Yes)Of people who do not celebrate Thanksgiving 23.5294% are from Pacific, while lowest percentage is for people who are from New England and West North Central with 4.4118.
10 cells have zero values which is the lowest percentage value. While highest percentage of 11.7647 occurs to people from Pacific and in the age category 30-44.
attach(Thanksgiving_No)

#kable(addmargins(table(age,us_region)))  %>%
#  kable_styling("striped",full_width = F) %>%
#  column_spec(11,bold = T,color = "red") %>%
#  row_spec(5,bold = T,color = "red")

# table of percentages for people who do not celebrate
kable(addmargins(round(prop.table(table(age,us_region)),6)*100),"html")  %>%
  kable_styling("striped",full_width = T,font_size = 9) %>%
  column_spec(11,bold = T,color = "red") %>%
  row_spec(5,bold = T,color = "red") %>%
  column_spec(1,bold = T,width = '2cm') %>%
row_spec(0,bold = T,align = 'center')| East North Central | East South Central | Middle Atlantic | Mountain | New England | Pacific | South Atlantic | West North Central | West South Central | Sum | |
|---|---|---|---|---|---|---|---|---|---|---|
| 18 - 29 | 1.4706 | 2.9412 | 8.8235 | 4.4118 | 0.0000 | 7.3529 | 4.4118 | 2.9412 | 5.8824 | 38.2354 |
| 30 - 44 | 2.9412 | 0.0000 | 5.8824 | 1.4706 | 1.4706 | 11.7647 | 5.8824 | 0.0000 | 2.9412 | 32.3531 |
| 45 - 59 | 2.9412 | 2.9412 | 4.4118 | 2.9412 | 2.9412 | 1.4706 | 4.4118 | 0.0000 | 0.0000 | 22.0590 |
| 60+ | 0.0000 | 0.0000 | 1.4706 | 0.0000 | 0.0000 | 2.9412 | 1.4706 | 1.4706 | 0.0000 | 7.3530 |
| Sum | 7.3530 | 5.8824 | 20.5883 | 8.8236 | 4.4118 | 23.5294 | 16.1766 | 4.4118 | 8.8236 | 100.0005 |
detach(Thanksgiving_No)Gender Distribution
We have two types of gender categories in this data set which are male and female. According to the people who celebrate Thanksgiving 515 are Female, while only 432 are male. Here also there are 33 missing observations and they have been removed.
But this is not the case for those who do not celebrate Thanksgiving. Female have a count of only 29, where males have a count of 49. There were no missing observations.
attach(Thanksgiving_Yes)
attach(Thanksgiving_No)
# people who do not celebrate
dont_sex<-as.data.frame(summary.factor(Thanksgiving_No$gender))
# people who do celebrate
do_sex<-as.data.frame(summary.factor(na.omit(Thanksgiving_Yes$gender)))
# people who do celebrate
data_do_sex<-data.frame(group=c("Female","Male"),
                  values=do_sex$`summary.factor(na.omit(Thanksgiving_Yes$gender))`,
                  frame=rep("Do Celebrate",2))
# people who do not celebrate
data_dont_sex<-data.frame(group=c("Female","Male"),
                          values=dont_sex$`summary.factor(Thanksgiving_No$gender)`,
                          frame=rep("Do not Celebrate",2))
# combining both
data_sex<-rbind(data_do_sex,data_dont_sex)

# animated plot for people who do celebrate and who do not celebrate
ggplot(data_sex,aes(group,values))+
  geom_bar(stat = 'identity',position = "identity")+
  ylab("Frequency")+xlab("Gender")+
  ggtitle("Animated plot how Do and Do not people prefer \naccording to Gender")+
  scale_y_continuous(labels= seq(0,520,10),breaks = seq(0,520,10))+
  geom_text(aes(label=values), vjust=1)+
  transition_states(frame,transition_length = 2,state_length = 3)+
  enter_fade()+
  exit_shrink()+
  ease_aes('elastic-in-out')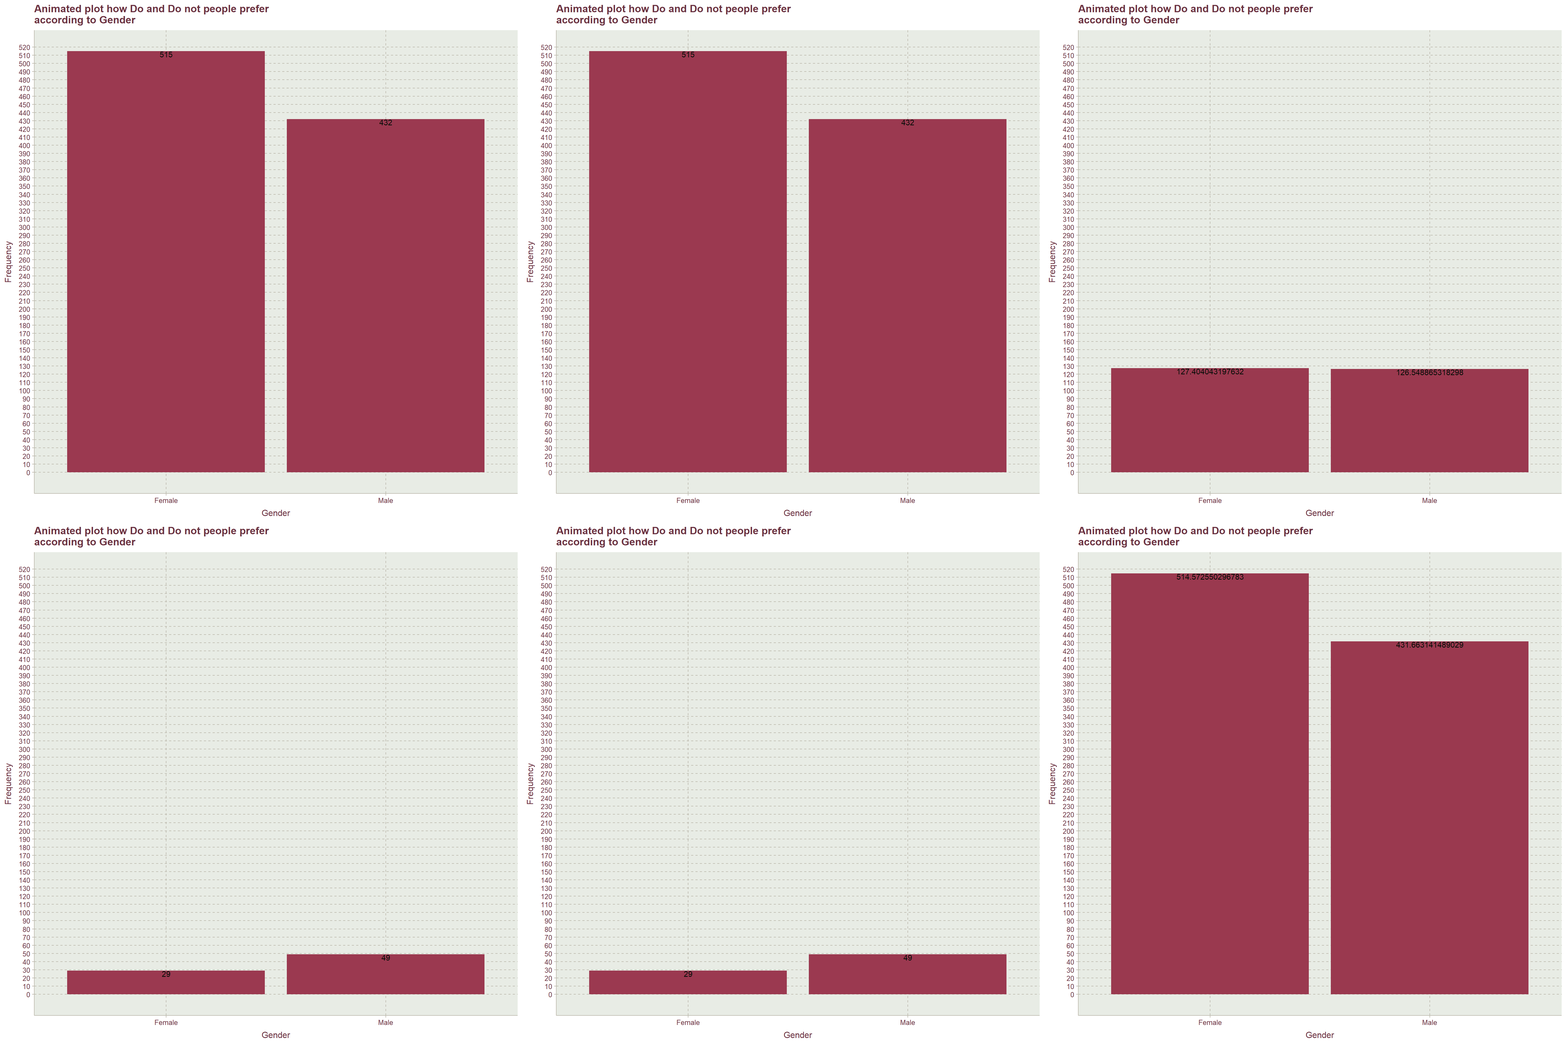
detach(Thanksgiving_Yes)
detach(Thanksgiving_No)
Gender with Other Factors
Of people who do celebrate Thanksgiving highest percentage of 10.14 goes to Females where Family Income is USD 25,000 to 49,999. While lowest percentage of 1.27 goes to Males of Family Income category USD 175,000 to 199,999.
attach(Thanksgiving_Yes)

#kable(addmargins(table(gender,family_income)))  %>%
#  kable_styling("striped",full_width = F) %>%
#  column_spec(13,bold = T,color = "red") %>%
#  row_spec(3,bold = T,color = "red")

# table of percentages for people who do celebrate
kable(addmargins(round(prop.table(table(gender,family_income)),4)*100),"html")  %>%
  kable_styling("striped",full_width = T,font_size = 8.75) %>%
  column_spec(13,bold = T,color = "red") %>%
  row_spec(3,bold = T,color = "red") %>%
  column_spec(1,bold = T,width = '2cm') %>%
row_spec(0,bold = T,angle = 270,align = 'center')| 9,999 | 24,999 | 124,999 | 149,999 | 174,999 | 199,999 | $200,000 and up | 49,999 | 74,999 | 99,999 | Prefer not to answer | Sum | |
|---|---|---|---|---|---|---|---|---|---|---|---|---|
| Female | 2.64 | 3.80 | 5.39 | 2.11 | 2.11 | 1.48 | 4.44 | 10.14 | 7.92 | 6.97 | 7.39 | 54.39 |
| Male | 2.85 | 2.53 | 6.12 | 2.96 | 1.90 | 1.27 | 3.59 | 7.39 | 5.49 | 6.44 | 5.07 | 45.61 |
| Sum | 5.49 | 6.33 | 11.51 | 5.07 | 4.01 | 2.75 | 8.03 | 17.53 | 13.41 | 13.41 | 12.46 | 100.00 |
detach(Thanksgiving_Yes)3 cells in the below table are zero values, which is the lowest percentage value. Highest percentage of 14.1026 goes to Males who chose not to answer regarding Family Income where they do not celebrate Thanksgiving.
attach(Thanksgiving_No)

#kable(addmargins(table(gender,family_income)))  %>%
#  kable_styling("striped",full_width = F) %>%
#  column_spec(13,bold = T,color = "red") %>%
#  row_spec(3,bold = T,color = "red")

# table of percentages for people who do not celebrate
kable(addmargins(round(prop.table(table(gender,family_income)),6)*100),"html")  %>%
  kable_styling("striped",full_width = F,font_size = 10) %>%
  column_spec(13,bold = T,color = "red") %>%
  row_spec(3,bold = T,color = "red") %>%
  column_spec(1,bold = T,width = '1.5cm') %>%
row_spec(0,bold = T,angle = 270,align = 'center')| 9,999 | 24,999 | 124,999 | 149,999 | 174,999 | 199,999 | $200,000 and up | 49,999 | 74,999 | 99,999 | Prefer not to answer | Sum | |
|---|---|---|---|---|---|---|---|---|---|---|---|---|
| Female | 6.4103 | 3.8462 | 1.2821 | 1.2821 | 0.0000 | 0.0000 | 1.2821 | 5.1282 | 3.8462 | 5.1282 | 8.9744 | 37.1798 |
| Male | 11.5385 | 6.4103 | 1.2821 | 0.0000 | 2.5641 | 1.2821 | 3.8462 | 12.8205 | 6.4103 | 2.5641 | 14.1026 | 62.8208 |
| Sum | 17.9488 | 10.2565 | 2.5642 | 1.2821 | 2.5641 | 1.2821 | 5.1283 | 17.9487 | 10.2565 | 7.6923 | 23.0770 | 100.0006 |
detach(Thanksgiving_No)Female from South Atlantic who celebrate Thanksgiving have a highest percentage of 12.14. Where respondents from Mountain region and Males have the lowest percentage of 1.29.
attach(Thanksgiving_Yes)

#kable(addmargins(table(gender,us_region)))  %>%
#  kable_styling("striped",full_width = F) %>%
#  column_spec(11,bold = T,color = "red") %>%
#  row_spec(3,bold = T,color = "red")

# table of percentages for people who do celebrate
kable(addmargins(round(prop.table(table(gender,us_region)),4)*100),"html")  %>%
  kable_styling("striped",full_width = F,font_size = 10) %>%
  column_spec(11,bold = T,color = "red") %>%
  row_spec(3,bold = T,color = "red") %>%
  column_spec(1,bold = T,width = '1.5cm') %>%
row_spec(0,bold = T,align = 'center')| East North Central | East South Central | Middle Atlantic | Mountain | New England | Pacific | South Atlantic | West North Central | West South Central | Sum | |
|---|---|---|---|---|---|---|---|---|---|---|
| Female | 8.16 | 3.33 | 8.59 | 3.11 | 3.33 | 7.30 | 12.14 | 4.19 | 4.40 | 54.55 |
| Male | 7.41 | 2.69 | 6.98 | 1.29 | 2.58 | 6.66 | 9.67 | 3.44 | 4.73 | 45.45 |
| Sum | 15.57 | 6.02 | 15.57 | 4.40 | 5.91 | 13.96 | 21.81 | 7.63 | 9.13 | 100.00 |
detach(Thanksgiving_Yes)Male respondents who do not celebrate Thanksgiving where they are from Middle Atlantic have a highest percentage of 16.1765. Even though Females of West South Central have the lowest percentage of 1.4706 and Males from West North Central also have the same percentage value.
attach(Thanksgiving_No)

#kable(addmargins(table(gender,us_region)))  %>%
#  kable_styling("striped",full_width = F) %>%
#  column_spec(11,bold = T,color = "red") %>%
#  row_spec(3,bold = T,color = "red")

# table of percentages for people who do not celebrate
kable(addmargins(round(prop.table(table(gender,us_region)),6)*100),"html")  %>%
  kable_styling("striped",full_width = F,font_size = 10) %>%
  column_spec(11,bold = T,color = "red") %>%
  row_spec(3,bold = T,color = "red") %>%
  column_spec(1,bold = T,width = '1.5cm') %>%
row_spec(0,bold = T,align = 'center')| East North Central | East South Central | Middle Atlantic | Mountain | New England | Pacific | South Atlantic | West North Central | West South Central | Sum | |
|---|---|---|---|---|---|---|---|---|---|---|
| Female | 4.4118 | 2.9412 | 4.4118 | 4.4118 | 1.4706 | 8.8235 | 7.3529 | 2.9412 | 1.4706 | 38.2354 |
| Male | 2.9412 | 2.9412 | 16.1765 | 4.4118 | 2.9412 | 14.7059 | 8.8235 | 1.4706 | 7.3529 | 61.7648 |
| Sum | 7.3530 | 5.8824 | 20.5883 | 8.8236 | 4.4118 | 23.5294 | 16.1764 | 4.4118 | 8.8235 | 100.0002 |
detach(Thanksgiving_No)Family Income Distribution
There are 11 categories when it comes to Family Income. The option of Prefer Not to answer is given and has been chosen by people who celebrate and people who do not celebrate Thanksgiving.
Considering the people the who celebrate Thanksgiving, highest count of 166 goes to the category of 25,000 to 49,999 USD. While least count goes to 175,000 to 199,999 USD and the count is 26. Further, 118 people have chosen not to answer this question. 33 Missing observations were removed.
Where as in people who do not celebrate Thanksgiving, second highest count goes to the categories of 0 to 9,999 USD and 25,000 to 49,999 USD, where the count is 14. Similarly, for the least count of 1 also there are two Family Income categories, which are 125,000 to 149,999 USD and 175,000 to 199,999 USD. Prefer not to answer is the choice of 18 respondents who participated in this survey. No missing observations were recorded.
As before here also an animated bar plot is used to explain this.
attach(Thanksgiving_Yes)
attach(Thanksgiving_No)
# people who do not celebrate
dont_FI<-as.data.frame(summary.factor(Thanksgiving_No$family_income))
# people who do celebrate
do_FI<-as.data.frame(summary.factor(na.omit(Thanksgiving_Yes$family_income)))
# people who do celebrate
data_do_FI<-data.frame(group=c("0-9,999","10,000-24,999","25,000-49,999",
                               "50,000-74,999","75,000-99,999","100,000-124,999",
                               "125,000-149,999","150,000-174,999",
                               "175,000-199,999","200,000 and up","Not to answer"),
                       values=c(52,60,166,127,127,109,48,38,26,76,118),
                       frame=rep("Do Celebrate",11))
# people who do not celebrate
data_dont_FI<-data.frame(group=c("0-9,999","10,000-24,999","25,000-49,999",
                                 "50,000-74,999","75,000-99,999","100,000-124,999",
                               "125,000-149,999","150,000-174,999","175,000-199,999",
                               "200,000 and up","Not to answer"),
                         values=c(14,8,14,8,6,2,1,2,1,4,18),
                         frame=rep("Do not Celebrate",11))
# combine the dataset
data_FI<-rbind(data_do_FI,data_dont_FI)

# animated plot for people who do celebrate and who do not celebrate
ggplot(data_FI,aes(group,values))+
  geom_bar(stat = 'identity',position = "identity")+
  ylab("Frequency")+xlab("Family Income in dollars")+
  ggtitle("Animated plot how Do and Do not people prefer \naccording to Family Income")+
  scale_y_continuous(labels= seq(0,170,10),breaks = seq(0,170,10))+
  geom_text(aes(label=values), vjust=1)+coord_flip()+
  transition_states(frame,transition_length = 2,state_length = 3)+
  enter_fade()+
  exit_shrink()+
  ease_aes('bounce-in')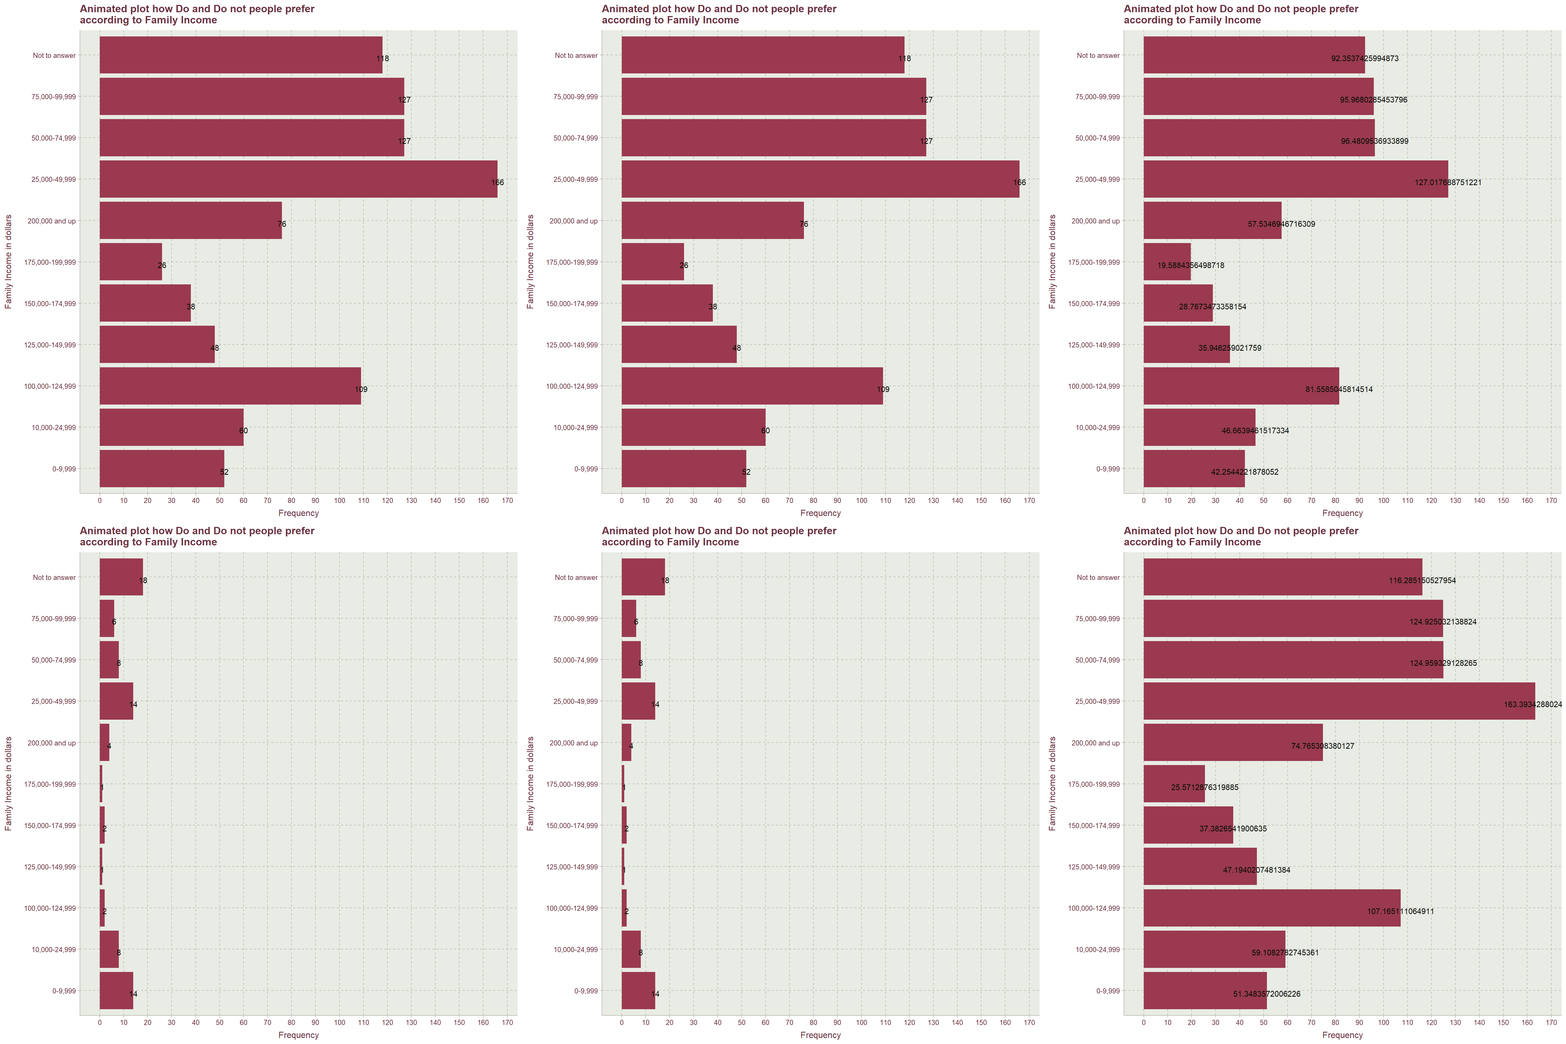
detach(Thanksgiving_Yes)
detach(Thanksgiving_No)
Family Income with Other Factors
Of people who do celebrate Thanksgiving the lowest percentage of zero is for people from West North Central with Family Income USD 175,000 to 199,999, people from West South Central with Family Income USD 175,000 to 199,999, people from Mountain with Family Income USD 150,000 to 174,999 and people from Mountain with Family Income USD 175,000 to 199,999. Highest percentage of 4.9409 goes to people from South Atlantic with Family Income USD 25,000 to 49,999.
attach(Thanksgiving_Yes)

#kable(addmargins(table(family_income,us_region)))  %>%
#  kable_styling("striped",full_width = F) %>%
#  column_spec(11,bold = T,color = "red") %>%
#  row_spec(12,bold = T,color = "red")

# table of percentages for people who do celebrate
kable(addmargins(round(prop.table(table(family_income,us_region)),6)*100),"html")%>%
  kable_styling("striped",full_width = F,font_size = 10) %>%
  column_spec(11,bold = T,color = "red") %>%
  row_spec(12,bold = T,color = "red") %>%
  column_spec(1,bold = T,width = '2.5cm') %>%
row_spec(0,bold = T,align = 'center')| East North Central | East South Central | Middle Atlantic | Mountain | New England | Pacific | South Atlantic | West North Central | West South Central | Sum | |
|---|---|---|---|---|---|---|---|---|---|---|
| 9,999 | 0.6445 | 0.2148 | 0.6445 | 0.1074 | 0.2148 | 1.0741 | 0.8593 | 0.2148 | 0.9667 | 4.9409 |
| 24,999 | 0.8593 | 0.6445 | 0.5371 | 0.1074 | 0.3222 | 1.5038 | 1.3963 | 0.5371 | 0.3222 | 6.2299 |
| 124,999 | 2.7927 | 0.8593 | 1.3963 | 0.4296 | 0.5371 | 1.6112 | 2.2556 | 0.3222 | 1.5038 | 11.7078 |
| 149,999 | 0.5371 | 0.1074 | 0.6445 | 0.3222 | 0.3222 | 0.6445 | 1.8260 | 0.2148 | 0.5371 | 5.1558 |
| 174,999 | 0.2148 | 0.2148 | 0.5371 | 0.0000 | 0.2148 | 0.9667 | 0.8593 | 0.3222 | 0.7519 | 4.0816 |
| 199,999 | 0.6445 | 0.2148 | 1.0741 | 0.0000 | 0.2148 | 0.3222 | 0.3222 | 0.0000 | 0.0000 | 2.7926 |
| $200,000 and up | 0.7519 | 0.4296 | 2.0408 | 0.6445 | 0.7519 | 1.0741 | 1.1815 | 0.5371 | 0.6445 | 8.0559 |
| 49,999 | 2.2556 | 1.1815 | 2.5779 | 0.6445 | 1.0741 | 2.1482 | 4.9409 | 1.5038 | 1.0741 | 17.4006 |
| 74,999 | 2.5779 | 0.9667 | 2.0408 | 0.5371 | 0.5371 | 1.8260 | 2.7927 | 1.3963 | 0.8593 | 13.5339 |
| 99,999 | 2.7927 | 0.8593 | 1.9334 | 0.8593 | 0.5371 | 1.2889 | 2.4705 | 1.2889 | 1.5038 | 13.5339 |
| Prefer not to answer | 1.5038 | 0.3222 | 2.1482 | 0.7519 | 1.1815 | 1.5038 | 2.9001 | 1.2889 | 0.9667 | 12.5671 |
| Sum | 15.5748 | 6.0149 | 15.5747 | 4.4039 | 5.9076 | 13.9635 | 21.8044 | 7.6261 | 9.1301 | 100.0000 |
detach(Thanksgiving_Yes)There are a lot of cell values which have zero therefore I am not going to state them. Further, Highest percentage value of 5.8824 is from people of Middle Atlantic and Family Income categories of USD 0 to 9,999 and USD 25,000 to 49,999.
attach(Thanksgiving_No)

#kable(addmargins(table(family_income,us_region)))  %>%
#  kable_styling("striped",full_width = F) %>%
#  column_spec(11,bold = T,color = "red") %>%
#  row_spec(12,bold = T,color = "red")

# table of percentages for people who do not celebrate
kable(addmargins(round(prop.table(table(family_income,us_region)),6)*100),"html")%>%
  kable_styling("striped",full_width = F,font_size = 10) %>%
  column_spec(11,bold = T,color = "red") %>%
  row_spec(12,bold = T,color = "red")%>%
  column_spec(1,bold = T,width = '2.5cm') %>%
row_spec(0,bold = T,align = 'center')| East North Central | East South Central | Middle Atlantic | Mountain | New England | Pacific | South Atlantic | West North Central | West South Central | Sum | |
|---|---|---|---|---|---|---|---|---|---|---|
| 9,999 | 0.0000 | 0.0000 | 5.8824 | 4.4118 | 0.0000 | 2.9412 | 2.9412 | 0.0000 | 1.4706 | 17.6472 |
| 24,999 | 0.0000 | 1.4706 | 0.0000 | 1.4706 | 0.0000 | 1.4706 | 1.4706 | 1.4706 | 1.4706 | 8.8236 |
| 124,999 | 0.0000 | 0.0000 | 1.4706 | 0.0000 | 0.0000 | 1.4706 | 0.0000 | 0.0000 | 0.0000 | 2.9412 |
| 149,999 | 1.4706 | 0.0000 | 0.0000 | 0.0000 | 0.0000 | 0.0000 | 0.0000 | 0.0000 | 0.0000 | 1.4706 |
| 174,999 | 0.0000 | 0.0000 | 2.9412 | 0.0000 | 0.0000 | 0.0000 | 0.0000 | 0.0000 | 0.0000 | 2.9412 |
| 199,999 | 0.0000 | 1.4706 | 0.0000 | 0.0000 | 0.0000 | 0.0000 | 0.0000 | 0.0000 | 0.0000 | 1.4706 |
| $200,000 and up | 1.4706 | 0.0000 | 0.0000 | 0.0000 | 1.4706 | 0.0000 | 2.9412 | 0.0000 | 0.0000 | 5.8824 |
| 49,999 | 2.9412 | 0.0000 | 5.8824 | 1.4706 | 1.4706 | 4.4118 | 2.9412 | 0.0000 | 0.0000 | 19.1178 |
| 74,999 | 1.4706 | 1.4706 | 1.4706 | 0.0000 | 0.0000 | 4.4118 | 0.0000 | 1.4706 | 1.4706 | 11.7648 |
| 99,999 | 0.0000 | 0.0000 | 0.0000 | 1.4706 | 1.4706 | 4.4118 | 1.4706 | 0.0000 | 0.0000 | 8.8236 |
| Prefer not to answer | 0.0000 | 1.4706 | 2.9412 | 0.0000 | 0.0000 | 4.4118 | 4.4118 | 1.4706 | 4.4118 | 19.1178 |
| Sum | 7.3530 | 5.8824 | 20.5884 | 8.8236 | 4.4118 | 23.5296 | 16.1766 | 4.4118 | 8.8236 | 100.0008 |
detach(Thanksgiving_No)US Region Distribution
There are 9 regions in both sides, and also both sides have missing values. People who do celebrate Thanksgiving have 49 missing values, while only 10 are missing values for people who do not celebrate Thanksgiving.
attach(Thanksgiving_Yes)
attach(Thanksgiving_No)
# people who do not celebrate
dont_USR<-as.data.frame(summary.factor(na.omit(Thanksgiving_No$us_region)))
# people who do celebrate
do_USR<-as.data.frame(summary.factor(na.omit(Thanksgiving_Yes$us_region)))
# people who do celebrate
data_do_USR<-data.frame(group=c("East North Central", "East South Central",
                                "West South Central", "West North Central",
                                "Middle Atlantic","South Atlantic", "Mountain",
                                "New England", "Pacific"),
                       values=c(145,56,85,71,145,203,41,55,130),
                       frame=rep("Do Celebrate",9))
# people who do not celebrate
data_dont_USR<-data.frame(group=c("East North Central", "East South Central",
                                  "West South Central", "West North Central",
                                "Middle Atlantic","South Atlantic", "Mountain",
                                "New England", "Pacific"),
                         values=c(5,4,6,3,14,11,6,3,16),
                         frame=rep("Do not Celebrate",9))
# combine both datasets
data_USR<-rbind(data_do_USR,data_dont_USR)

# animated plot for people who do celebrate and who do not celebrate
ggplot(data_USR,aes(x=str_wrap(group,7),values))+
  geom_bar(stat = 'identity',position = "identity")+
  ylab("Frequency")+xlab("US Regions")+
  ggtitle("Animated plot how Do and Do not people prefer \naccording to US Regions")+
  scale_y_continuous(labels= seq(0,210,10),breaks = seq(0,210,10))+
  geom_text(aes(label=values), vjust=1)+
  transition_states(frame,transition_length = 2,state_length = 3)+
  enter_fade()+
  exit_shrink()+
  ease_aes('cubic-in-out')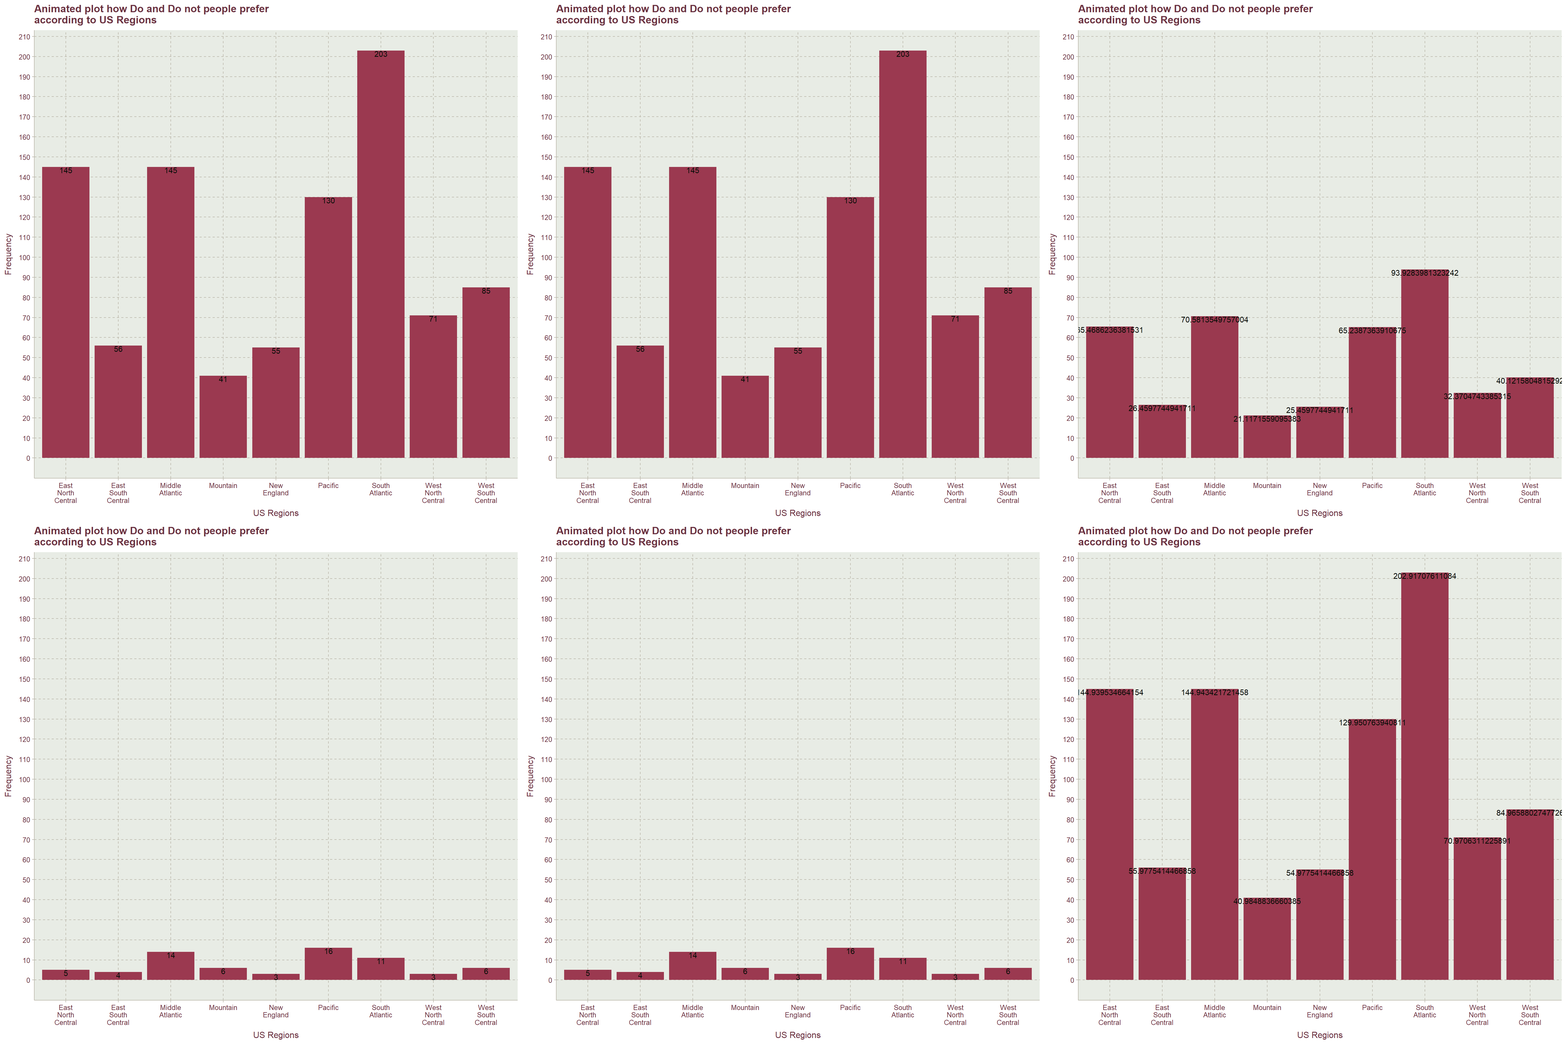
detach(Thanksgiving_Yes)
detach(Thanksgiving_No)
Conclusion
I shall conclude my findings in point form
We can use gganimate to make bar plots interesting and useful.
kable is very useful because of styling options.
Further Analysis
There are more than 50 variables therefore much more can be done than describing the data-set.
We can use advanced methods such as clustering and model fitting.
Please see that
This is my fourth post on the internet so please be kind to tolerate my mistakes in grammar and spellings. I intend to post more statistics related materials in the future and learn accordingly. Thank you for reading.
THANK YOU

