library(readr)
library(tidyverse)
library(lubridate)
library(gganimate)

player_dob <- read_csv("player_dob.csv",
                        col_types = cols(date_of_birth = col_date(format = "%Y-%m-%d"),
                        date_of_first_title = col_date(format = "%Y-%m-%d")))
grand_slams <- read_csv("grand_slams.csv",
                        col_types = cols(gender = col_factor(levels = c("Female","Male")),
                        rolling_win_count = col_integer(),
                        tournament_date = col_date(format = "%Y-%m-%d"),
                        year = col_integer()))
grand_slam_timeline <- read_csv("grand_slam_timeline.csv",
                                col_types = cols(gender = col_factor(levels = c("Female","Male")),
                                year = col_integer()))
Winning the Wimbledon as your first grand slam looks very thin than other three tournaments. Also among the top 10 most grand slam winners Roger Federer and Chris Evert have reached semi-finals only a lot of times. .code : https://t.co/tOify2Npwd #tidytuesday pic.twitter.com/9Vfa3CXmne
— Amalan Mahendran (@Amalan_Con_Stat) April 9, 2019
Player Information
Decade of Birth vs First Grand Slam Title Won
player_dob %>%
   remove_missing() %>%
   mutate(grand_slam=recode_factor(grand_slam,
                                  'Wimbledon'="Wimbledon",
                                  'US Open'="US Open",
                                  'French Open'="French Open",
                                  'Australian Open'="Aus Open",
                                  'Australian Open (January)'="Aus Open",
                                  'Australian Open (Jan)'="Aus Open",
                                  'Australian Open (December)'="Aus Open",
                                  'Australian Open (Jan.)'="Aus Open"
                                  )) %>%
  mutate(Birth=year(date_of_birth)) %>%
  mutate(Birth=cut(Birth,breaks = c(1929,1939,1949,1959,1969,1979,1989,1999),
                   labels = c(1930,1940,1950,1960,1970,1980,1990)
                   )) %>%
  group_by(Birth,grand_slam) %>%
  count()  %>%
ggplot(.,aes(x=factor(Birth),y=n,fill=grand_slam))+
      geom_col(position = "dodge")+
      scale_y_continuous(breaks=seq(1,11,1),labels=seq(1,11,1))+
      labs(fill="Grand Slam")+
      geom_text(aes(label=n),position = position_dodge(width = 1),vjust=1)+
      xlab("Decade of Birth")+ylab("Count")+
      ggtitle("How Decade of Birth and First Win of Grand Slam changes")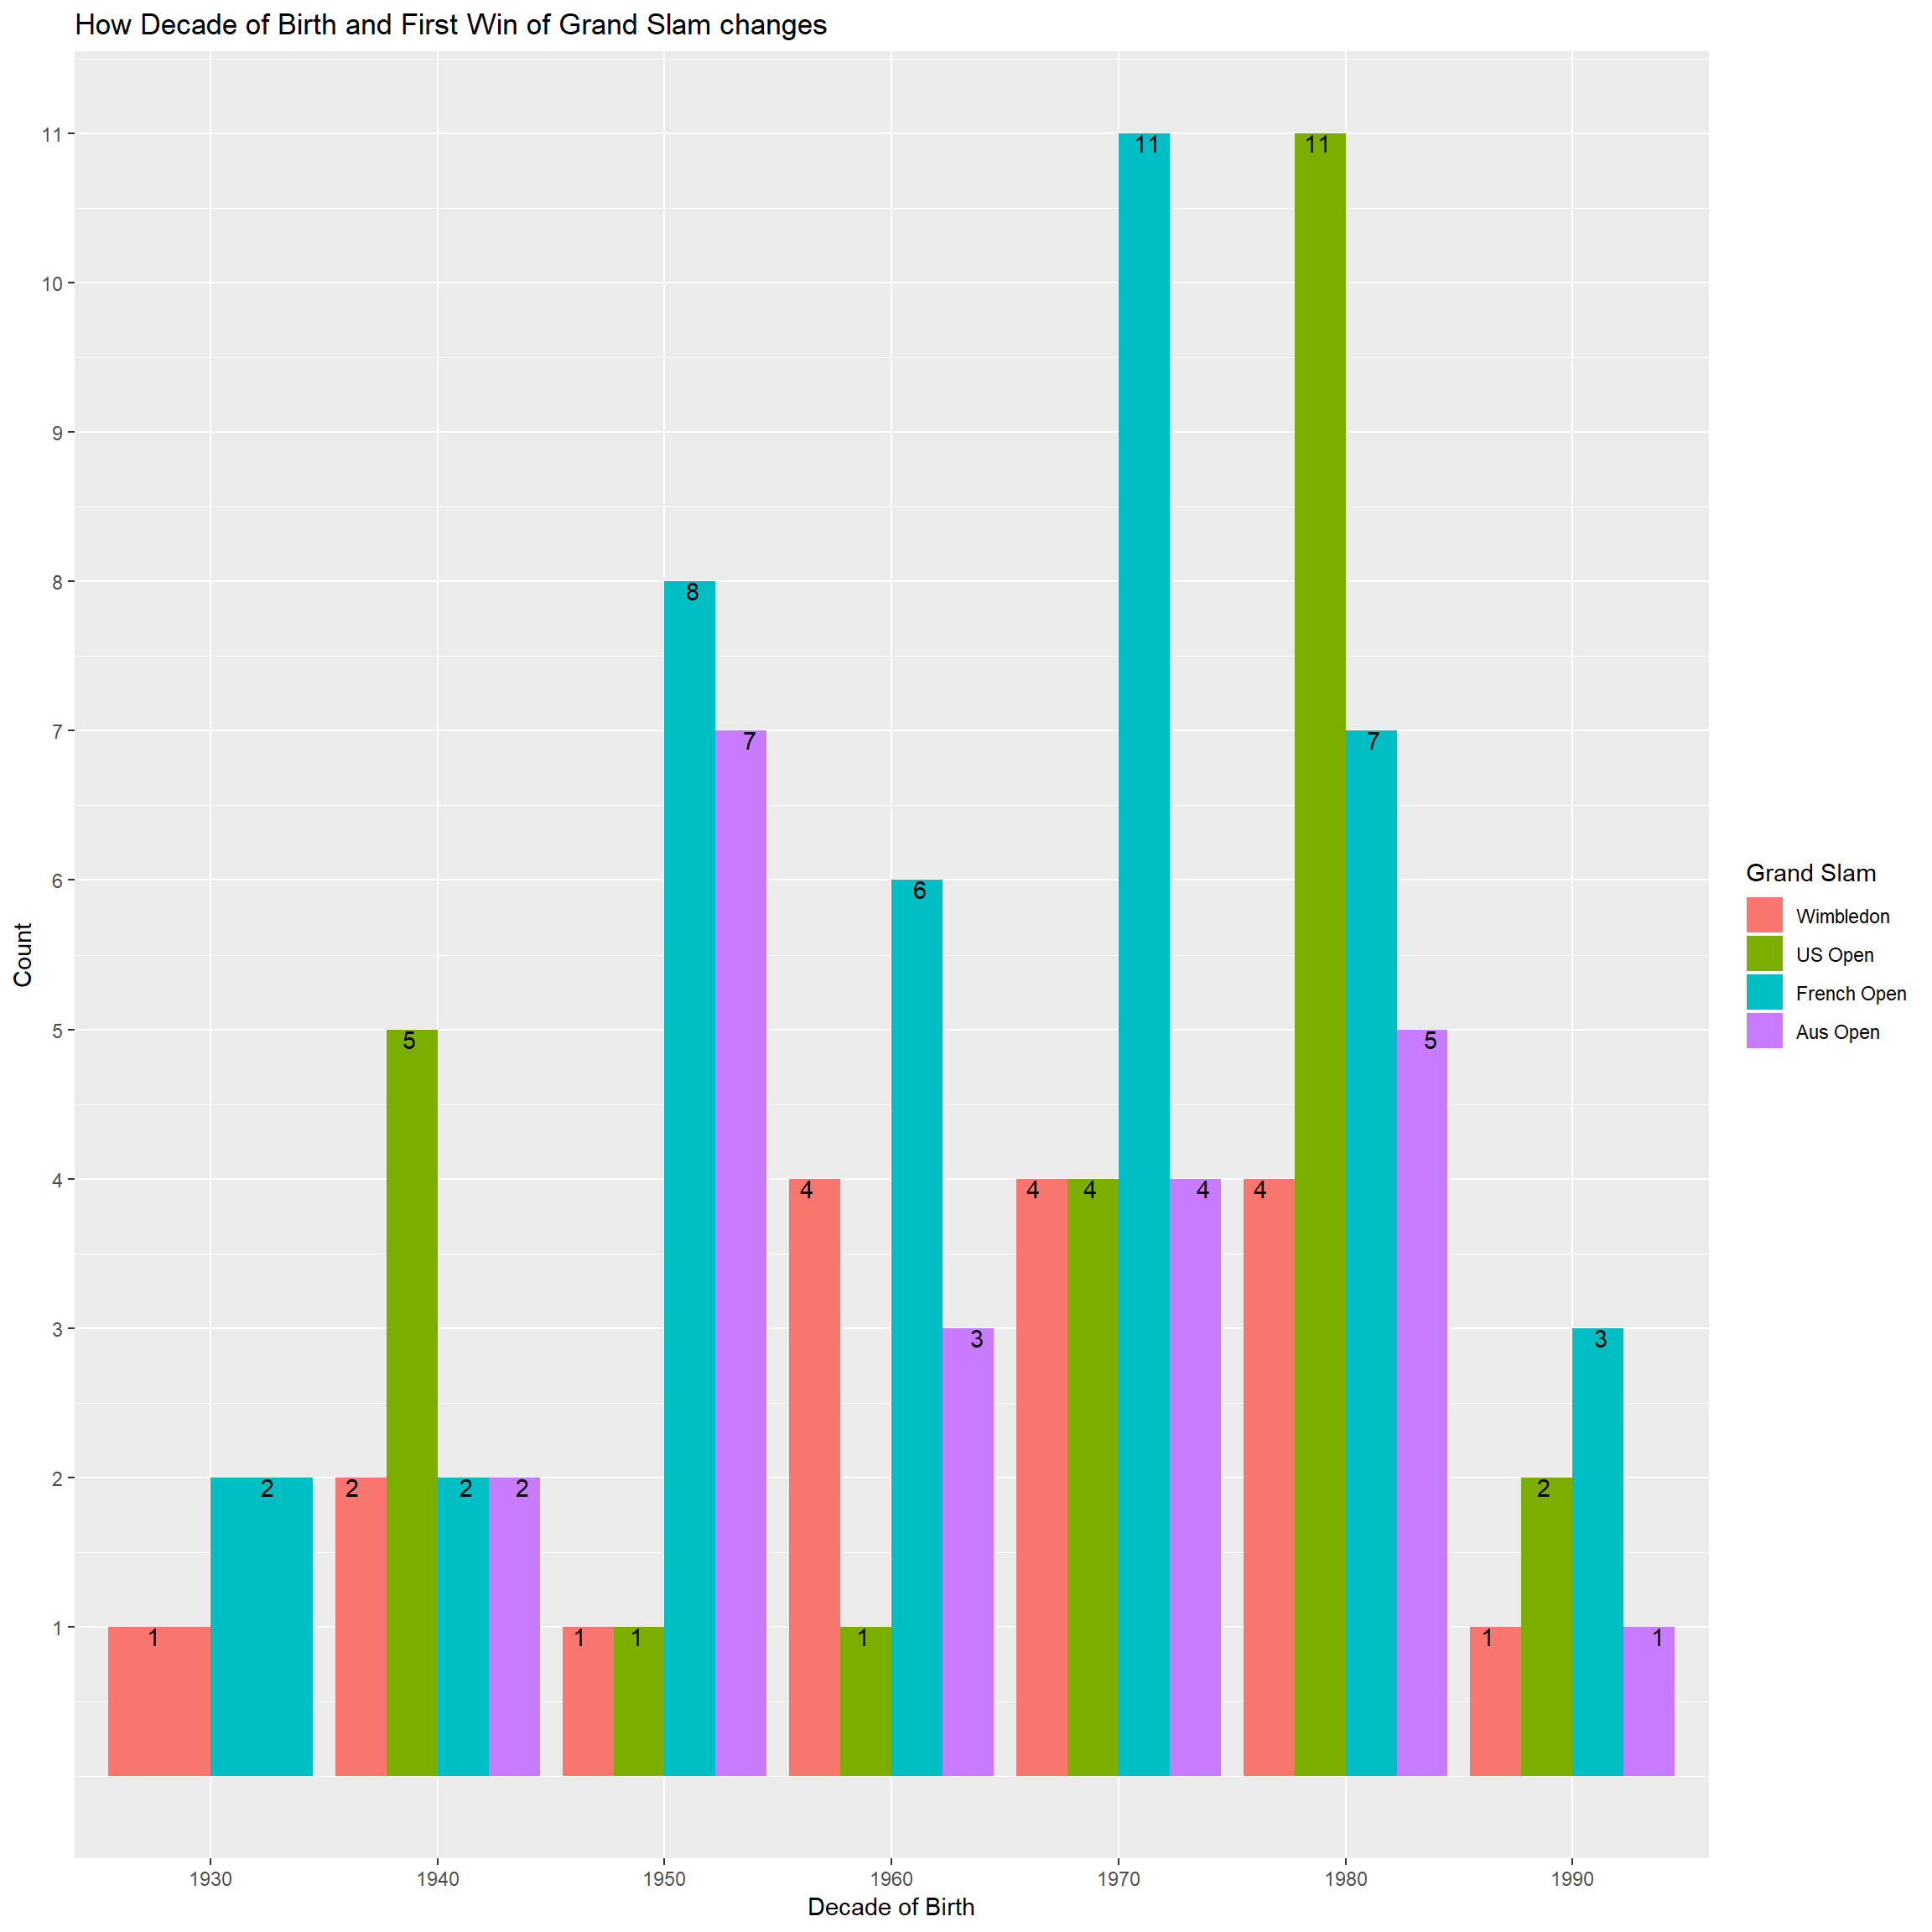
Decade of Birth vs First Grand Slam with Age
player_dob %>%
  remove_missing() %>%
  mutate(grand_slam=recode_factor(grand_slam,
                                  'Wimbledon'="Wimbledon",
                                  'US Open'="US Open",
                                  'French Open'="French Open",
                                  'Australian Open'="Aus Open",
                                  'Australian Open (January)'="Aus Open",
                                  'Australian Open (Jan)'="Aus Open",
                                  'Australian Open (December)'="Aus Open",
                                  'Australian Open (Jan.)'="Aus Open"
                                  )) %>%
  mutate(Birth=year(date_of_birth)) %>%
  mutate(Birth=cut(Birth,breaks = c(1929,1939,1949,1959,1969,1979,1989,1999),
                   labels = c(1930,1940,1950,1960,1970,1980,1990)
                   )) %>%
ggplot(.,aes(x=grand_slam,size=round(age/365),y=Birth))+
       geom_jitter()+
       xlab("Grand Slam")+ylab("Decade of Birth")+
       labs(color="Age",size="Age in Years")+
       ggtitle("Birth Decade vs First Grand Slam with Age")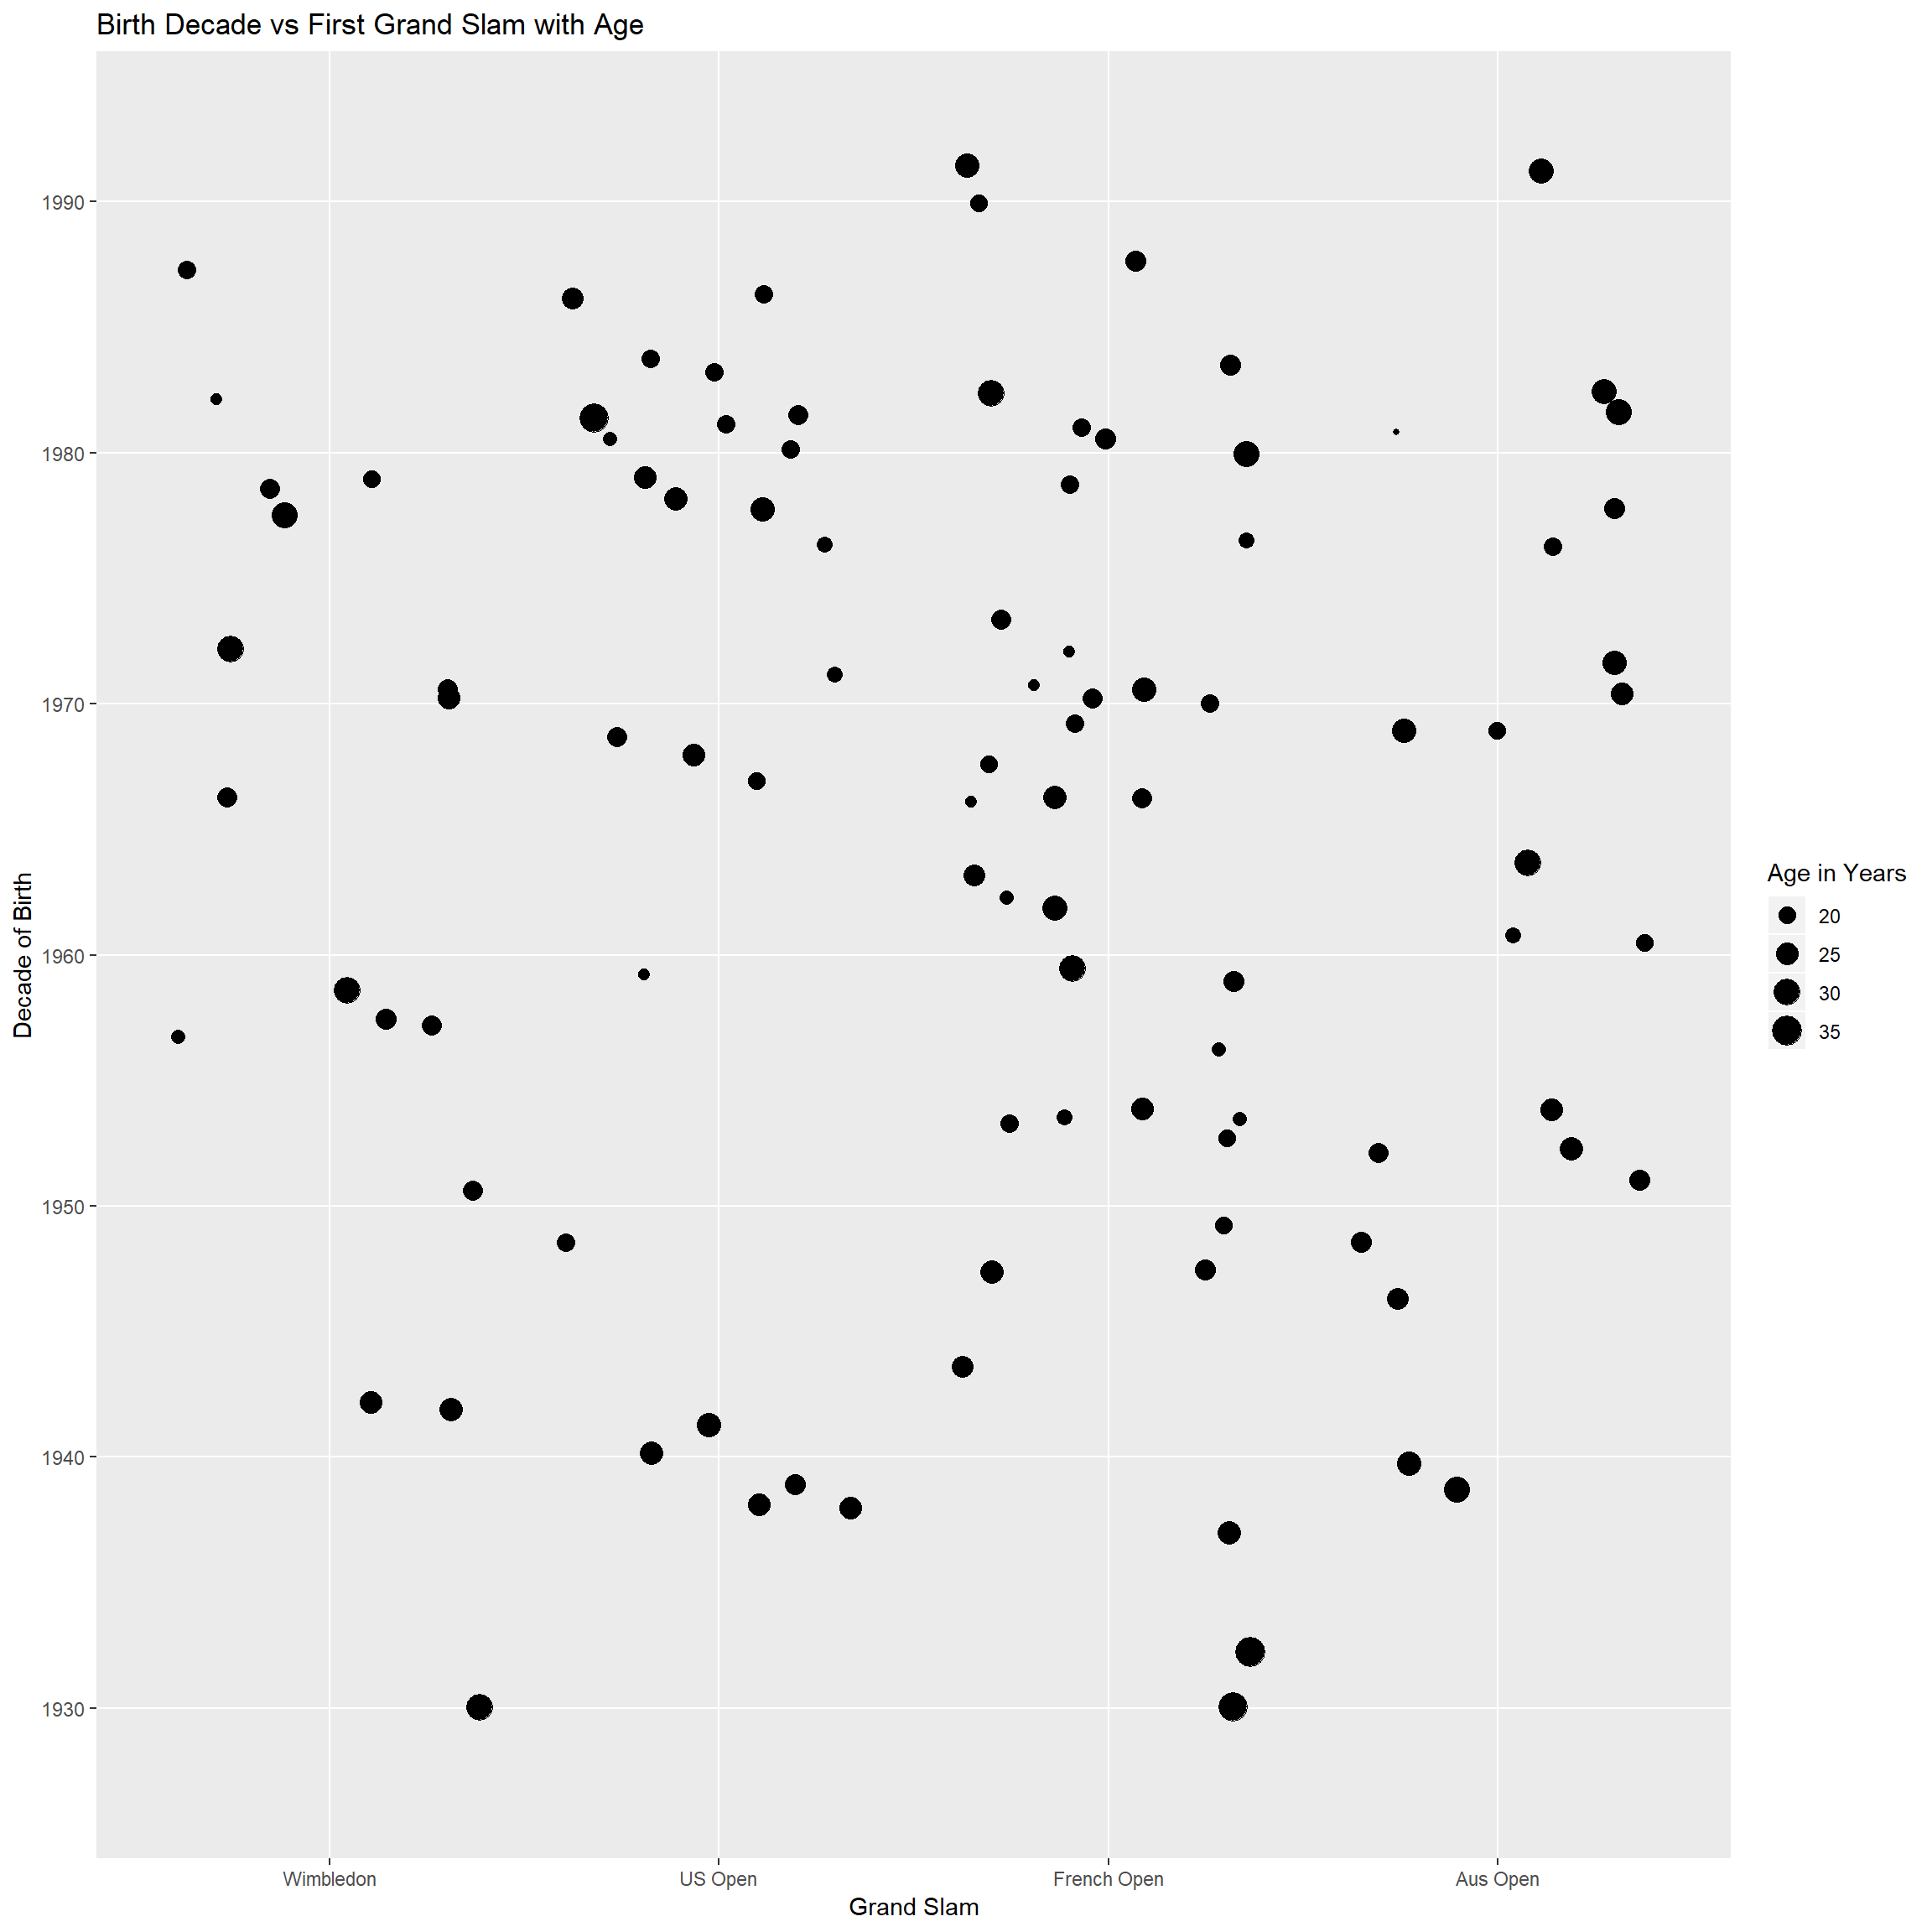
Grand Slams
Gender vs Grand Slam with Name
grand_slams %>%
      group_by(name,gender) %>%
      count(sort = TRUE) %>%
      head(25) %>%
      ggplot(.,aes(x=fct_inorder(name),y=n,
                   fill=gender,label=n))+
      geom_col()+xlab("Name")+ylab("Count")+
      labs(fill="Gender")+
      coord_flip()+geom_text(hjust =1)+
      ggtitle("Who won most with Gender")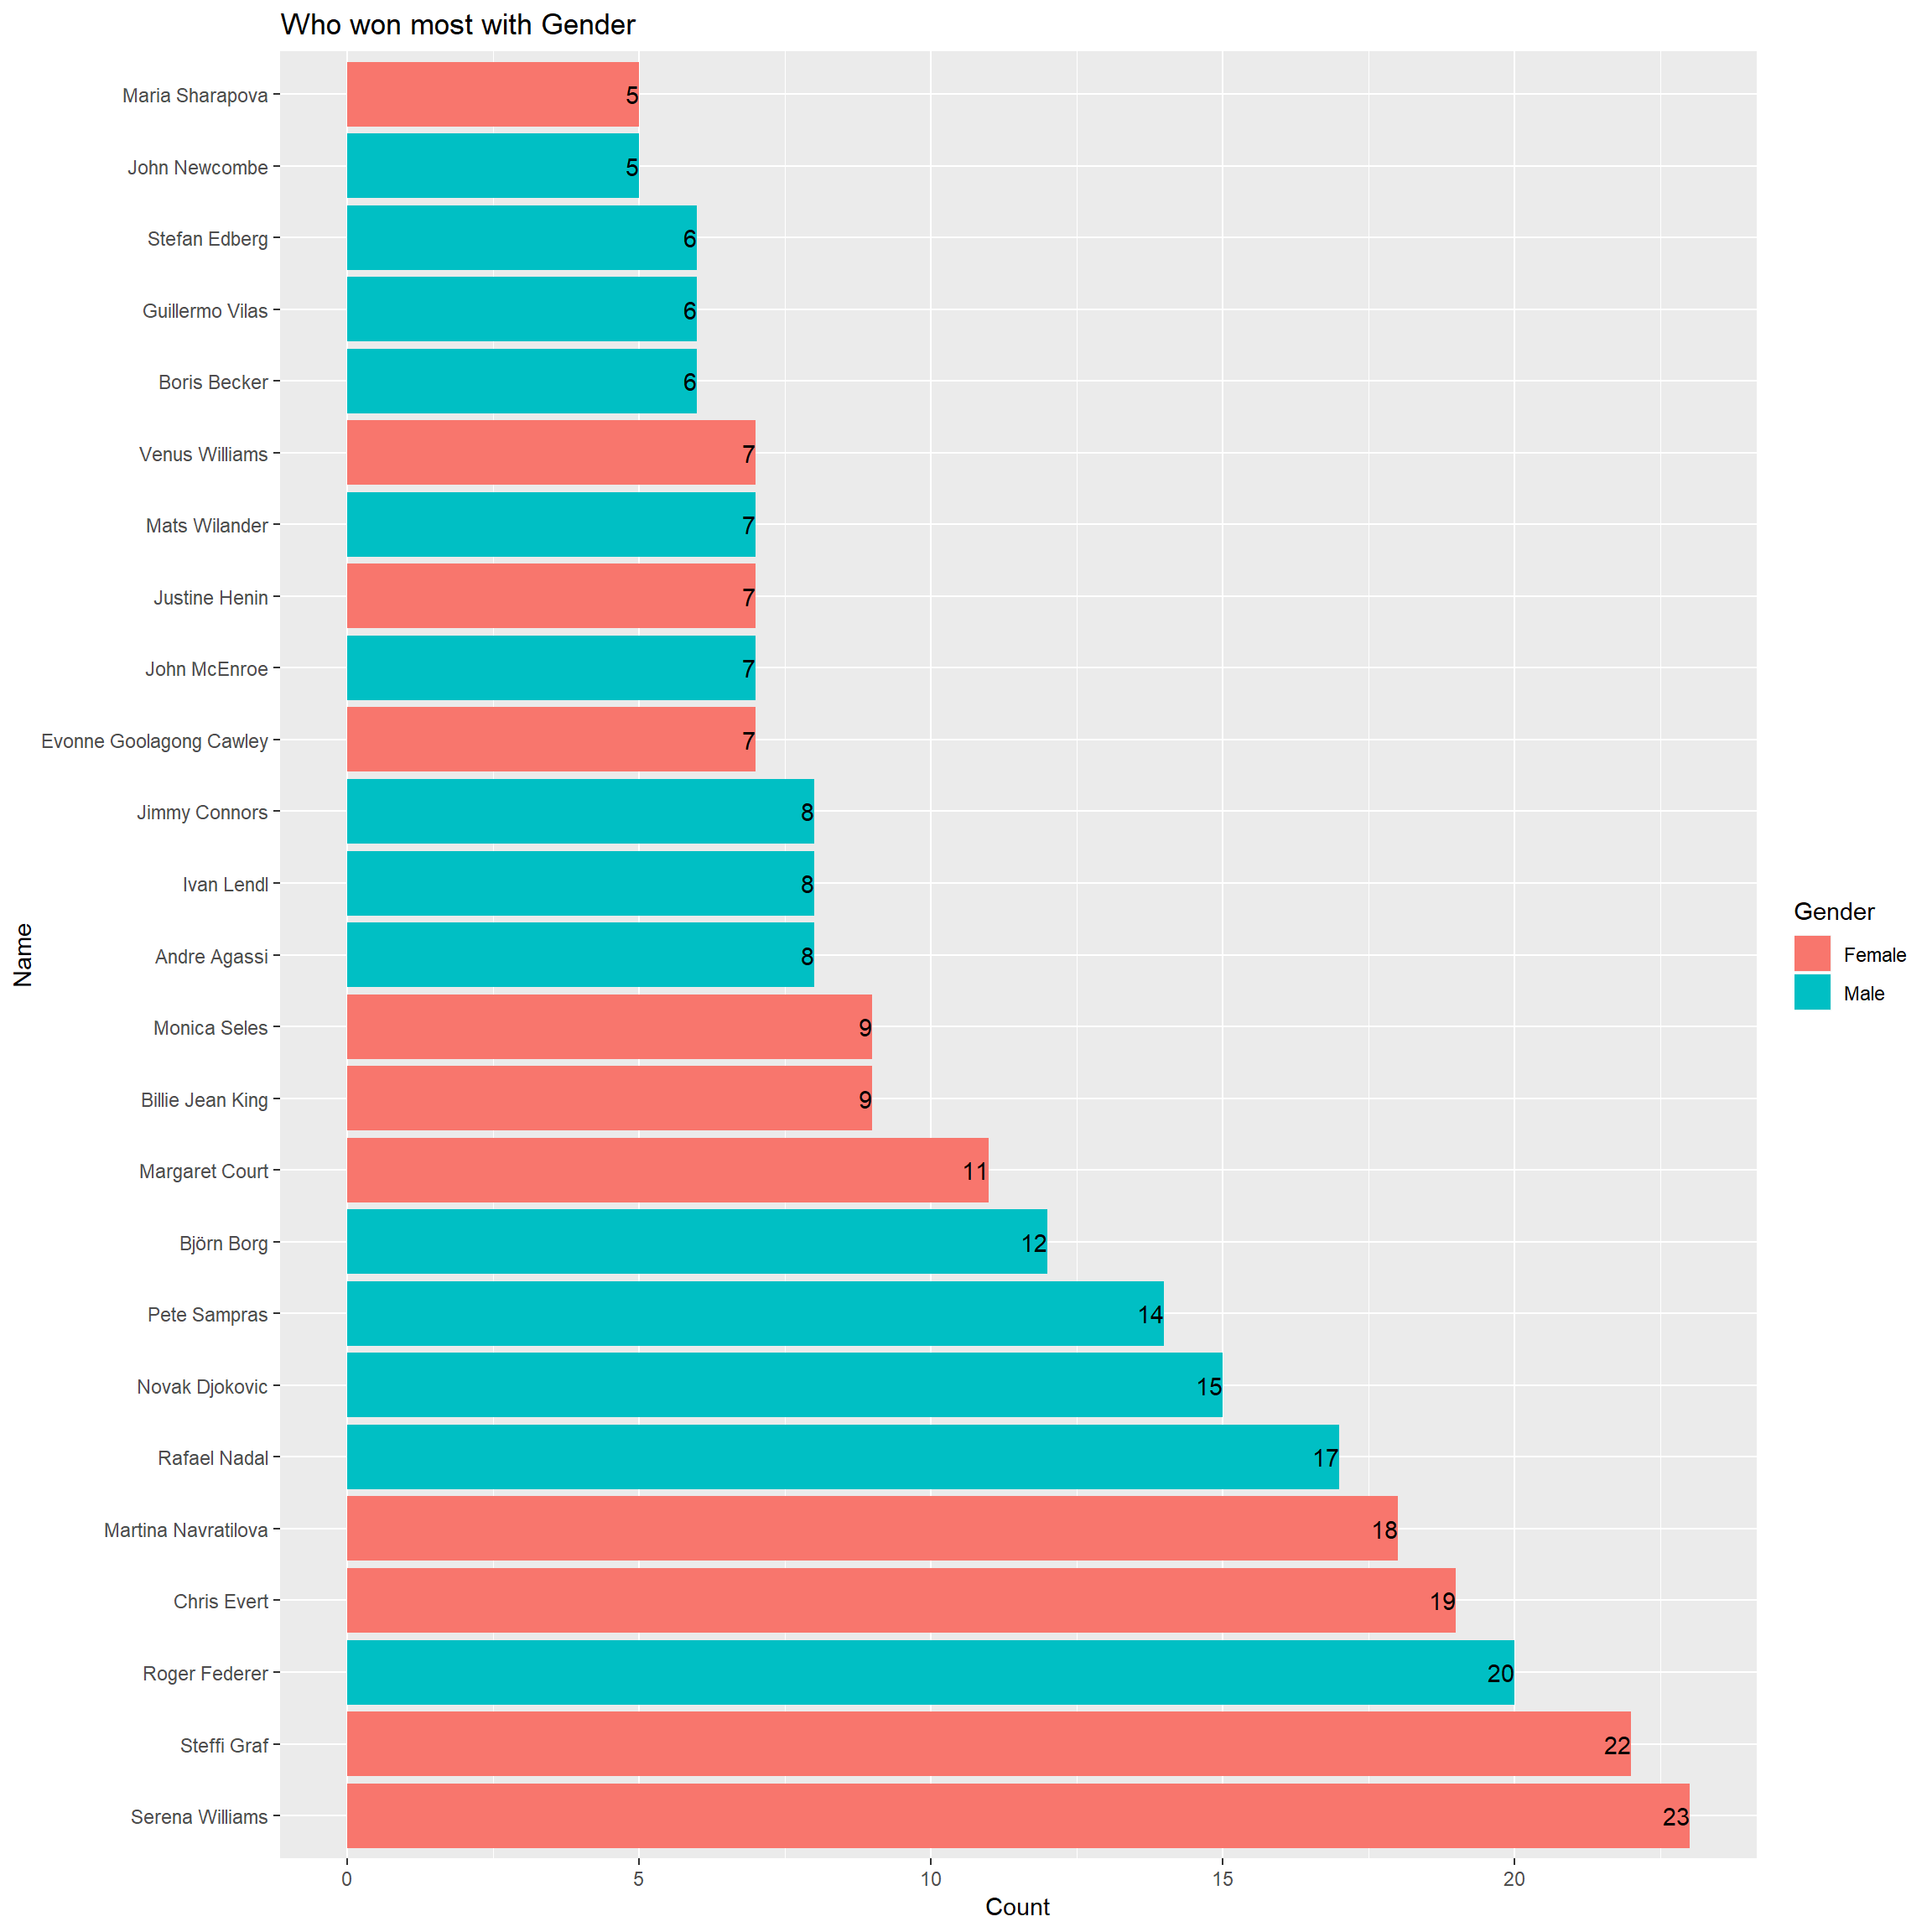
Gender vs Grand Slam with Year
p<-grand_slams %>%
      ggplot(.,aes(x=name,y=rolling_win_count,
                   shape=gender,color=grand_slam))+
      geom_point()+
      xlab("Name")+ylab("Cumulative Count")+
      labs(color="Grand Slam",shape="Gender")+
      transition_time(tournament_date)+ease_aes("linear")+
      coord_flip()+shadow_mark()+
      ggtitle("Cumulative progress with Year: {year(frame_time)}")

animate(p,nframes = 52,fps=1)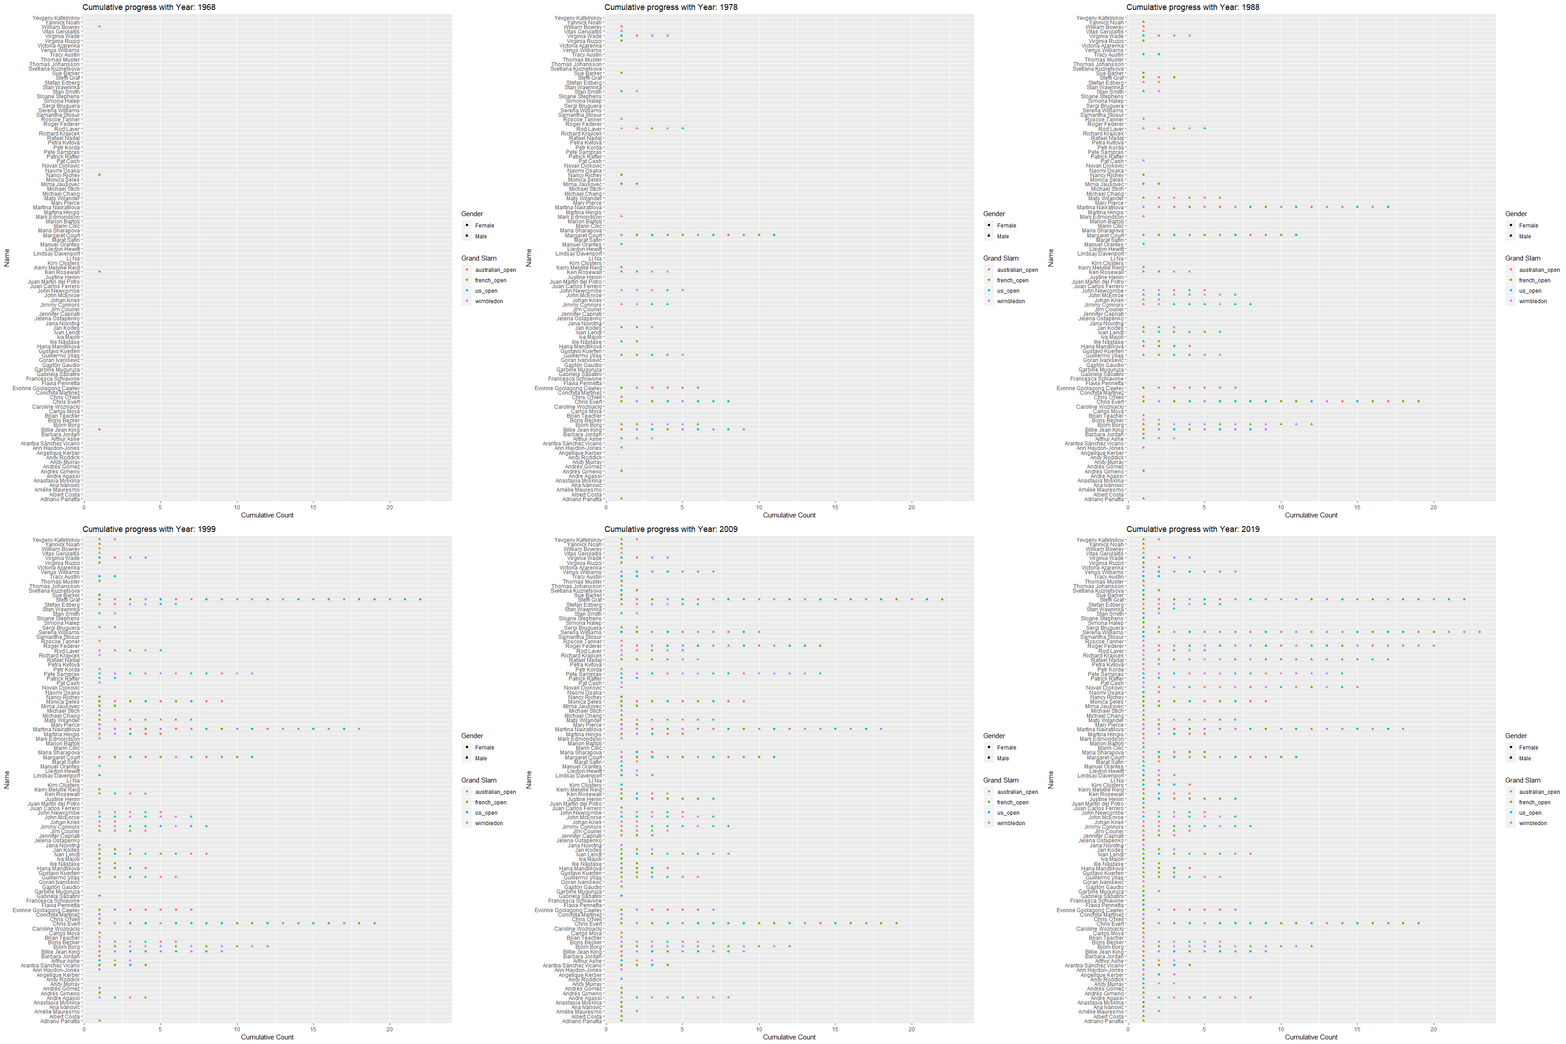
Grand Slam Timeline
Top 10 players and their Outcomes
top10<-grand_slams %>%
       group_by(name) %>%
       count(sort = TRUE) %>%
       head(10) %>%
       select(name)

grand_slam_timeline %>%
      rename(name="player") %>%
      inner_join(top10,"name") %>%
      group_by(name,outcome) %>%
      count() %>%
ggplot(.,aes(name,n,fill=outcome))+
      geom_col(position=position_dodge(width = 0.95))+
      geom_text(aes(label=n),position = position_dodge(width = 0.95),hjust=1)+
      coord_flip()+labs(fill="Outcome")+
      xlab("Name")+ylab("Count")+
      ggtitle("Top 10 Tennis Players and their Outcomes")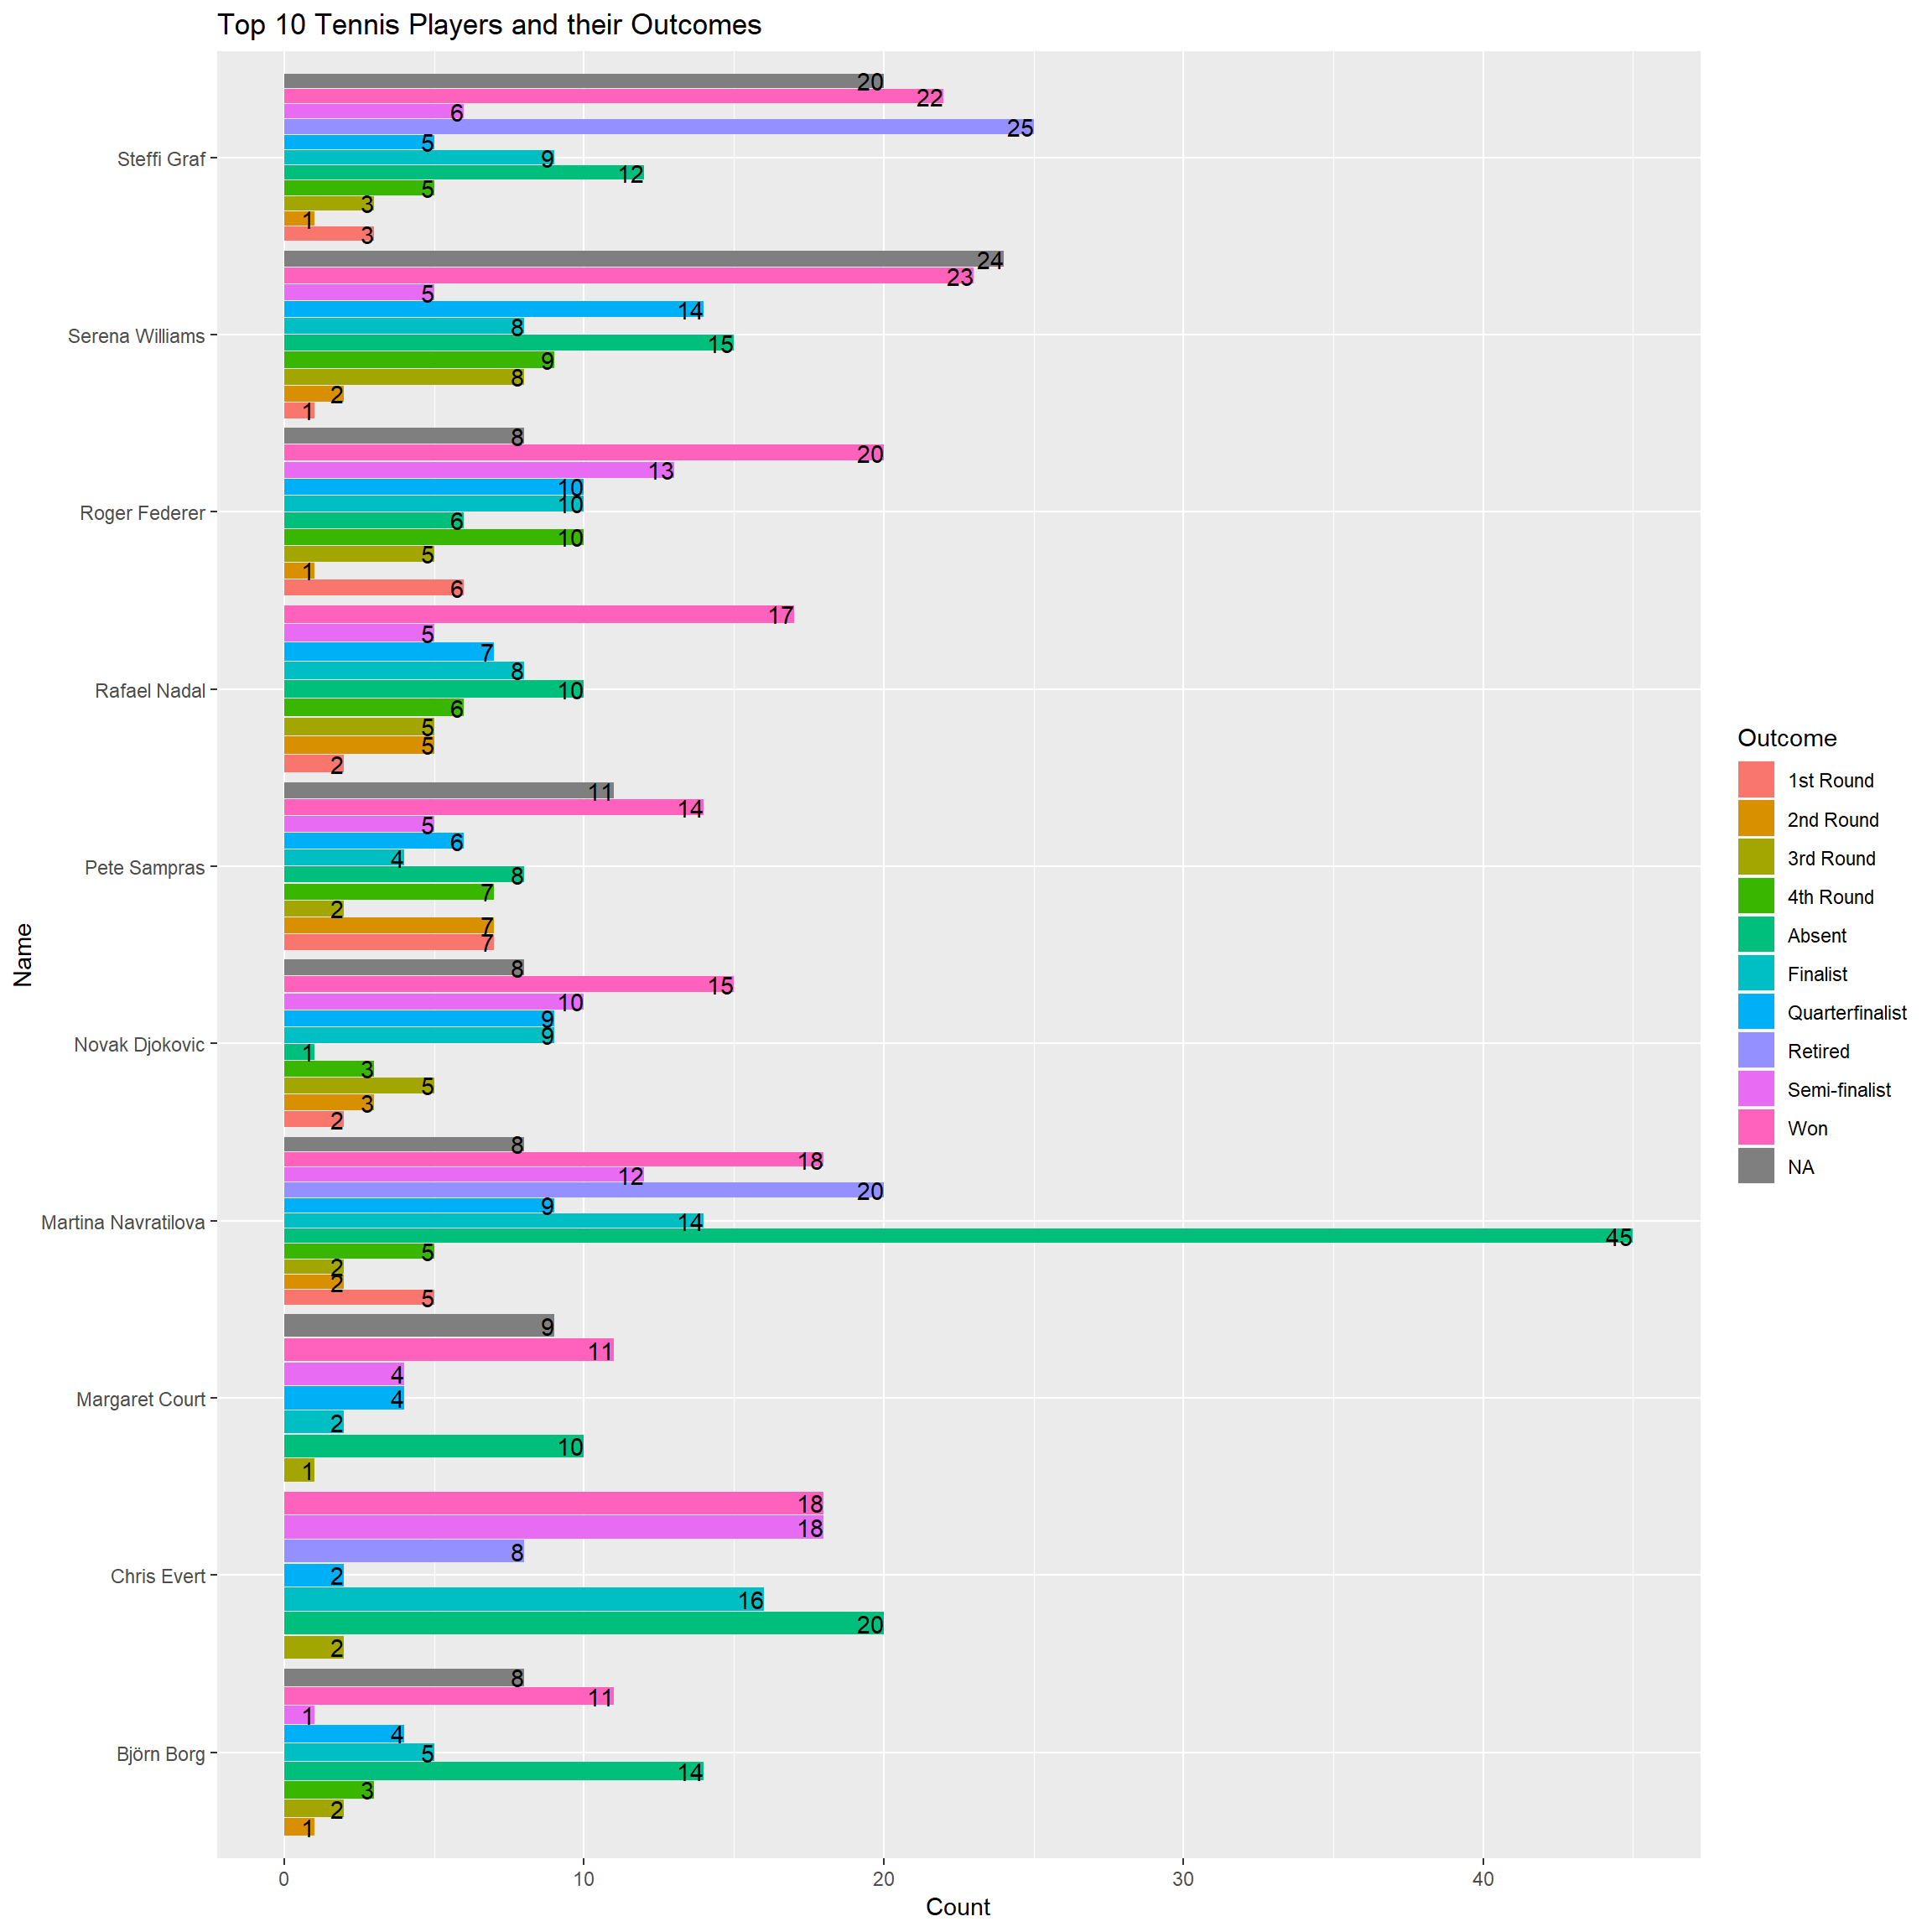
Top 10 Players and Tournament with outcomes of activeness
grand_slam_timeline %>%
      rename(name="player") %>%
      inner_join(top10,"name") %>%
      group_by(tournament,outcome) %>%
      count() %>%
ggplot(.,aes(x=tournament,y=n,fill=outcome))+
      geom_col(position =position_dodge(width=0.95))+
      geom_text(aes(label=n),position =position_dodge(width=0.95),vjust=1)+
      labs(fill="Outcome")+
      xlab("Tournament")+ylab("Count")+
      ggtitle("Tournament perspective of Top 10 Tennis Players and their Outcomes")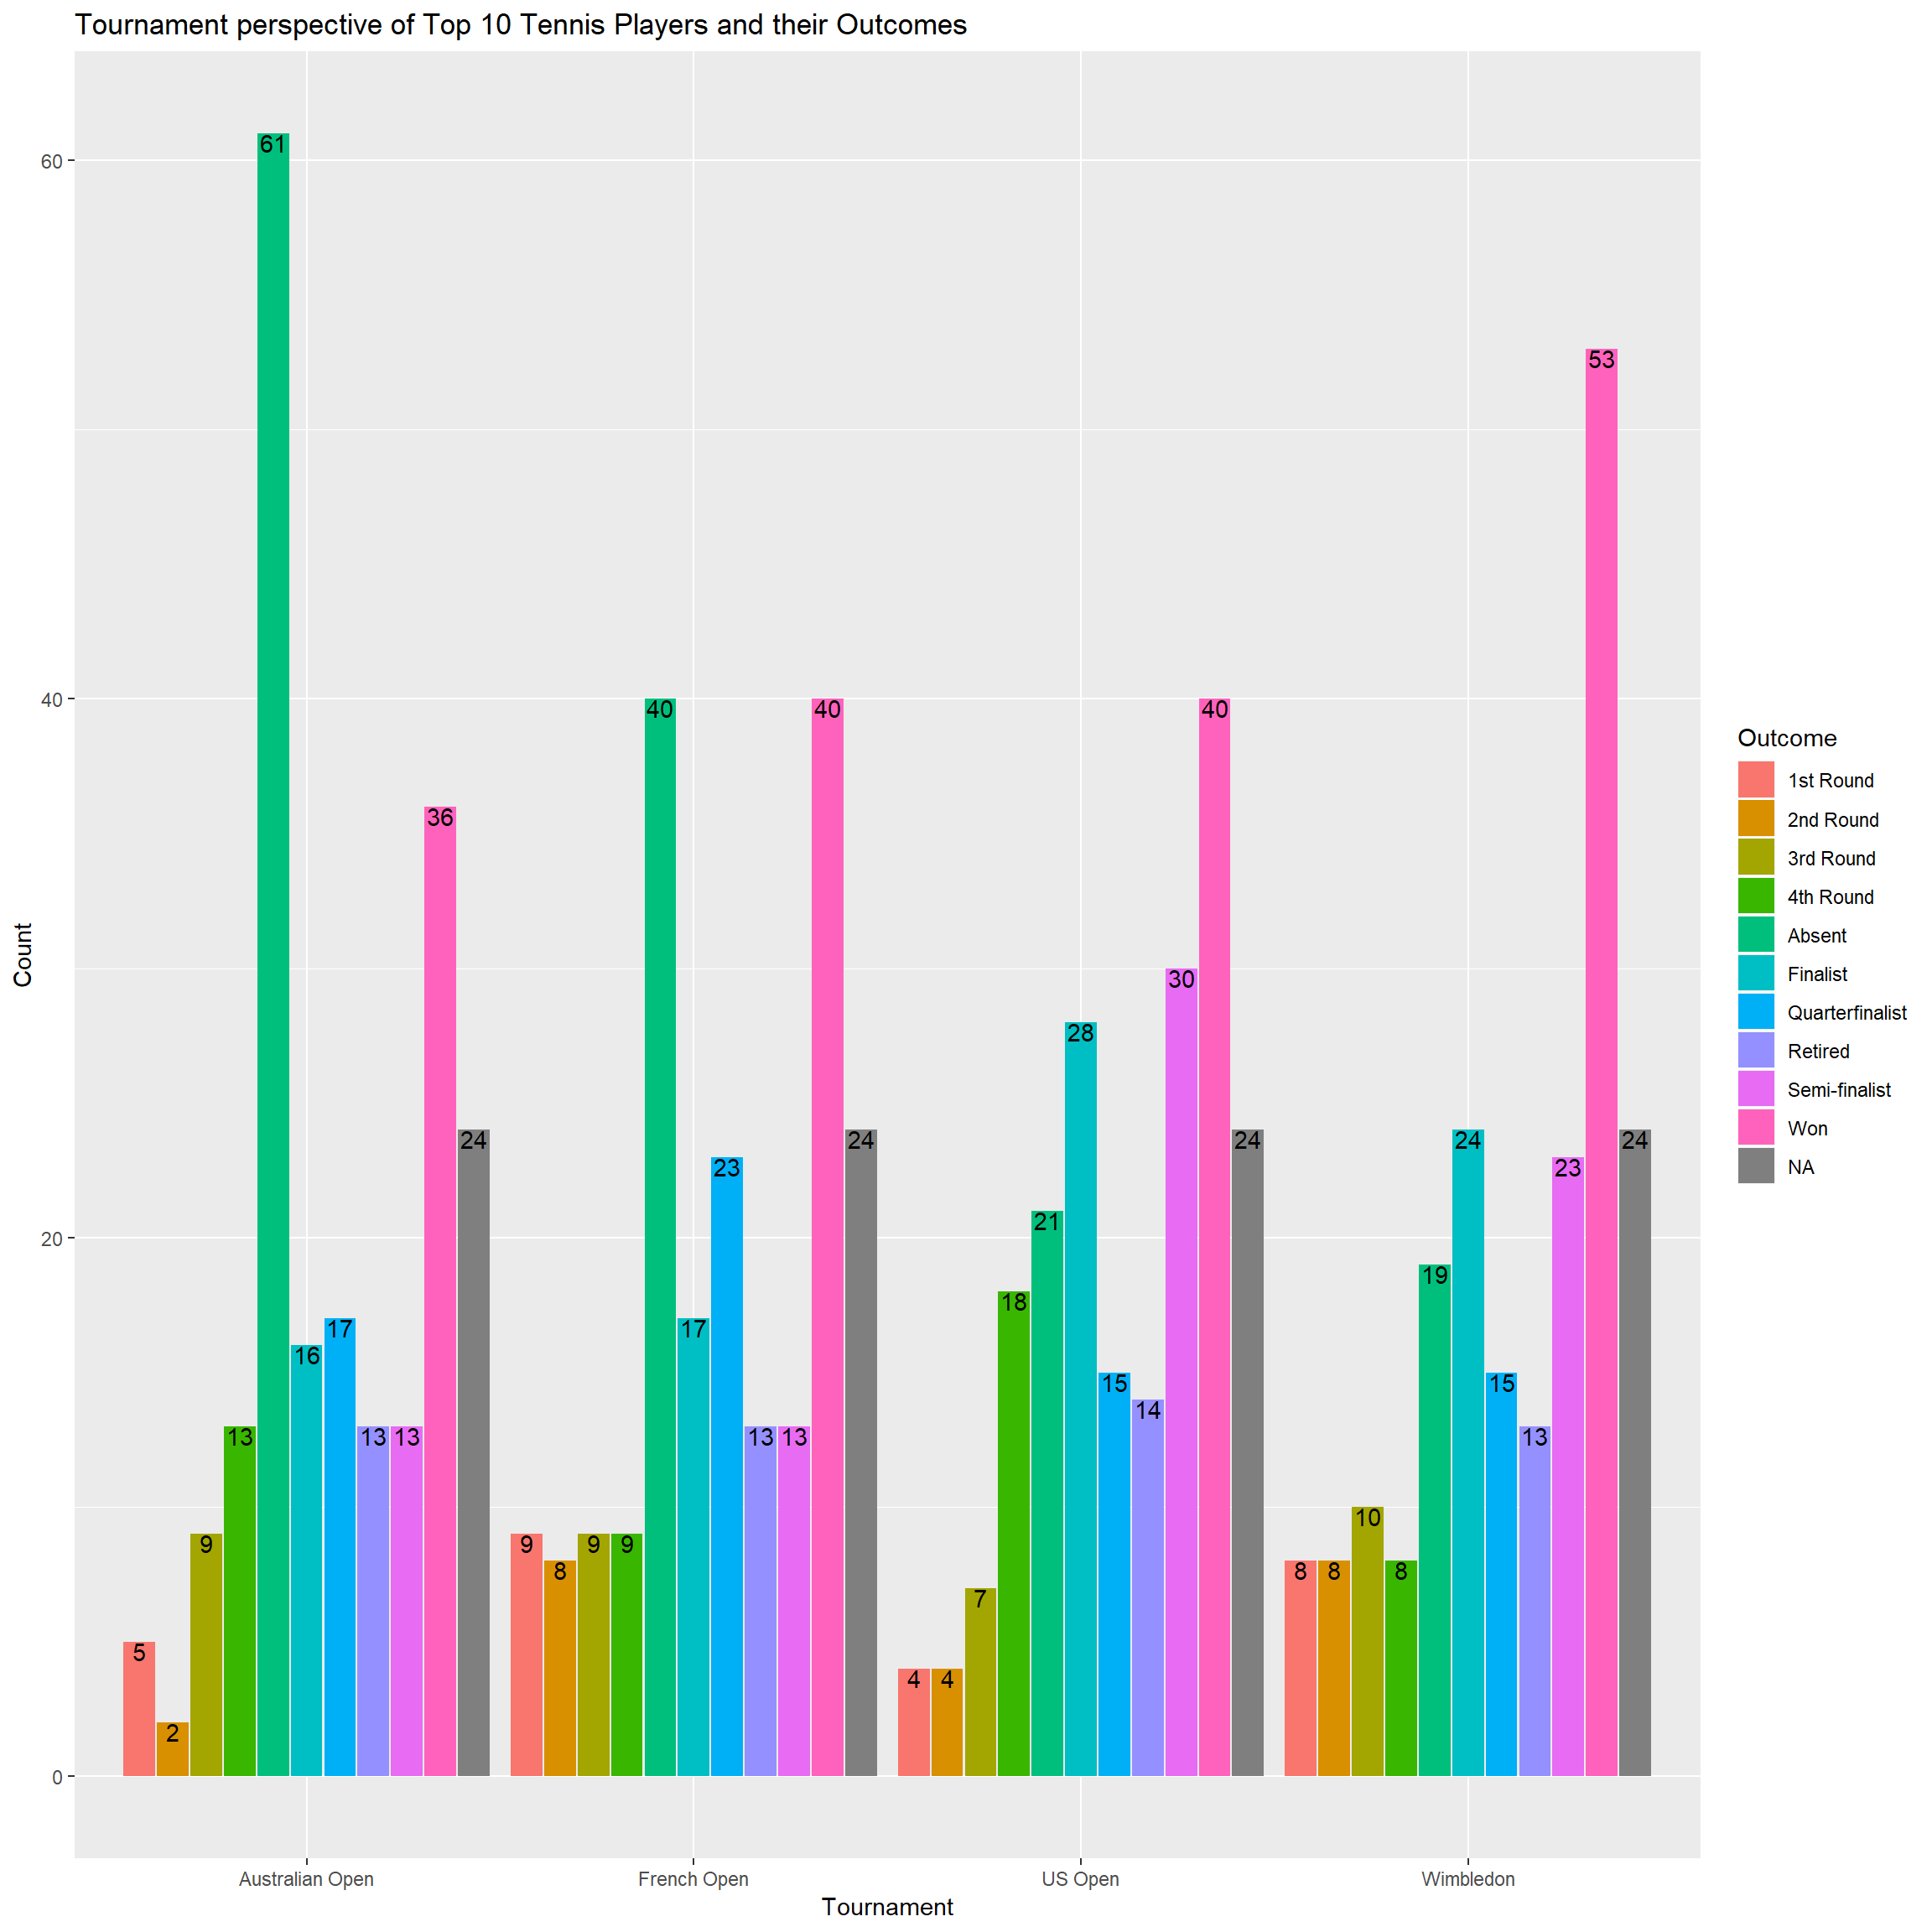
Top 10 Players Winning based on Tournament
grand_slam_timeline %>%
      rename(name="player") %>%
      inner_join(top10,"name") %>%
      subset(outcome=="Won") %>%
      group_by(name,tournament) %>%
      count() %>%
ggplot(.,aes(x=name,y=n,fill=tournament))+
      geom_col(position =position_dodge(width=0.95))+
      geom_text(aes(label=n),position =position_dodge(width=0.95),hjust=1)+
      coord_flip()+
      labs(fill="Tournament")+
      xlab("Name")+ylab("Count")+
      ggtitle("Winning, Top 10 Tennis Players with related to Tournament")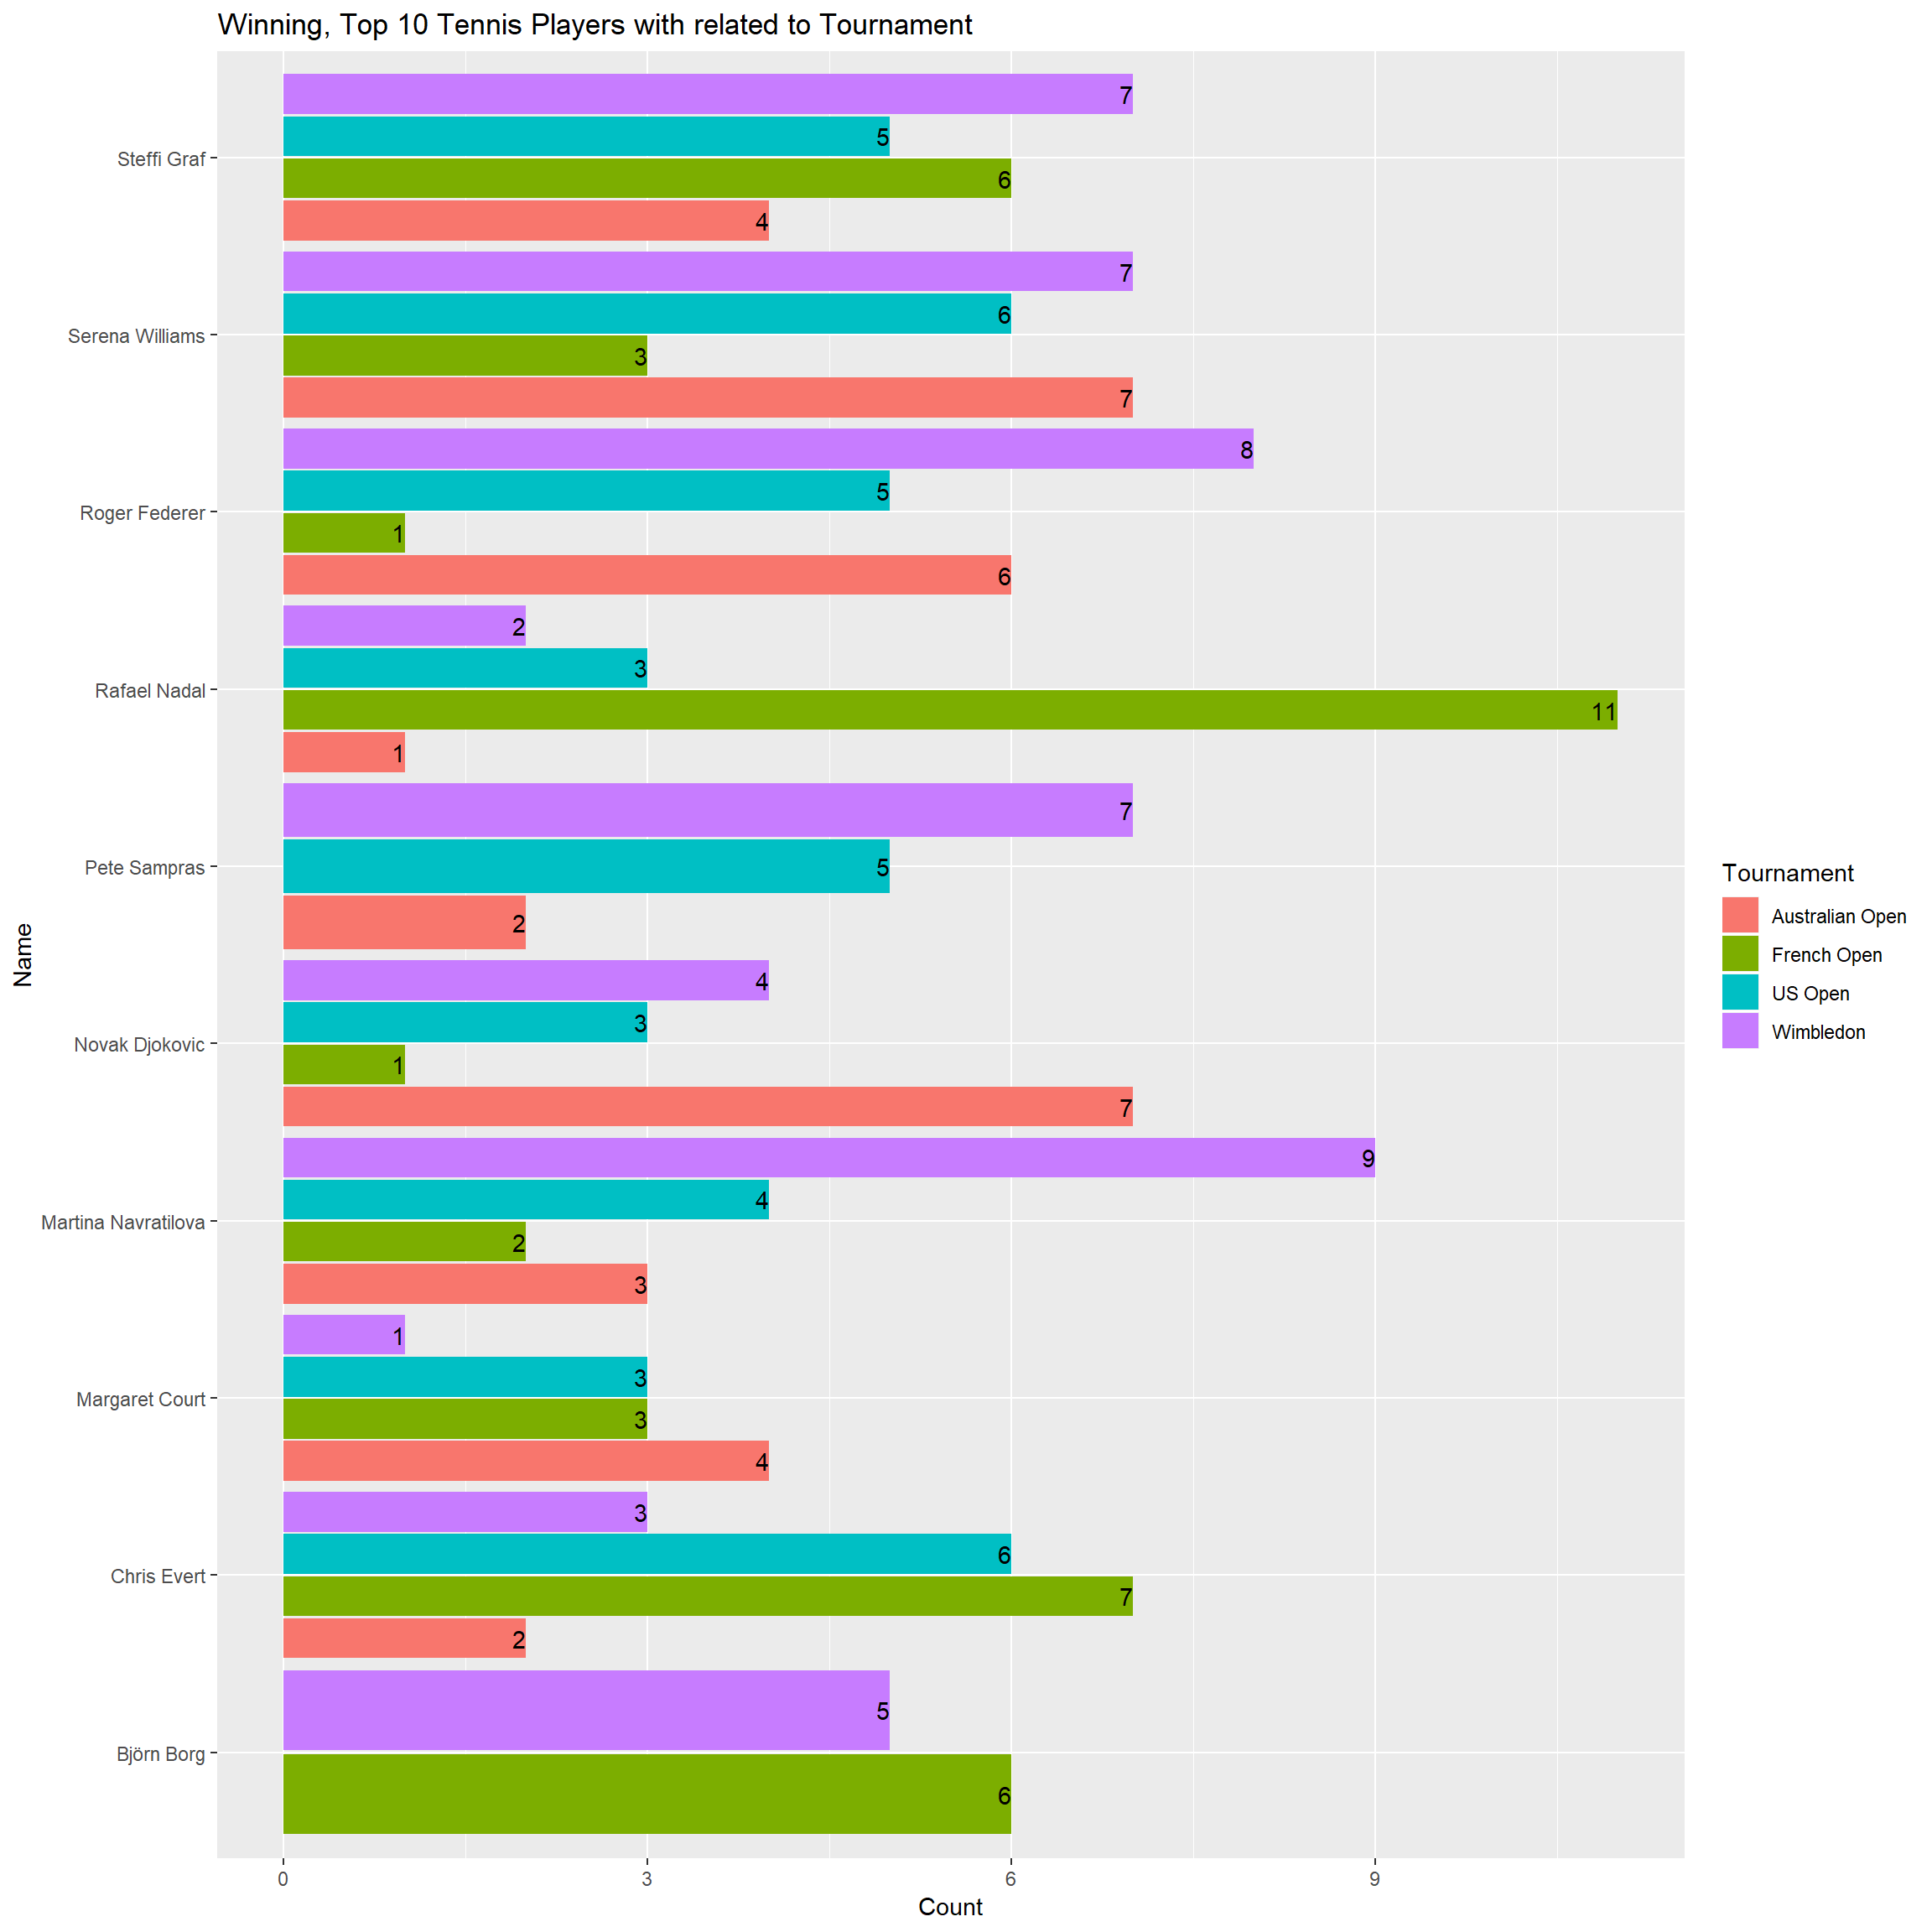
Top 10 Players Finalist based on Tournament
grand_slam_timeline %>%
      rename(name="player") %>%
      inner_join(top10,"name") %>%
      subset(outcome=="Finalist") %>%
      group_by(name,tournament) %>%
      count() %>%
ggplot(.,aes(x=name,y=n,fill=tournament))+
      geom_col(position =position_dodge(width=0.95))+
      geom_text(aes(label=n),position =position_dodge(width=0.95),hjust=1)+
      coord_flip()+
      labs(fill="Tournament")+
      xlab("Name")+ylab("Count")+
      ggtitle("Finalist, Top 10 Tennis Players with related to Tournament")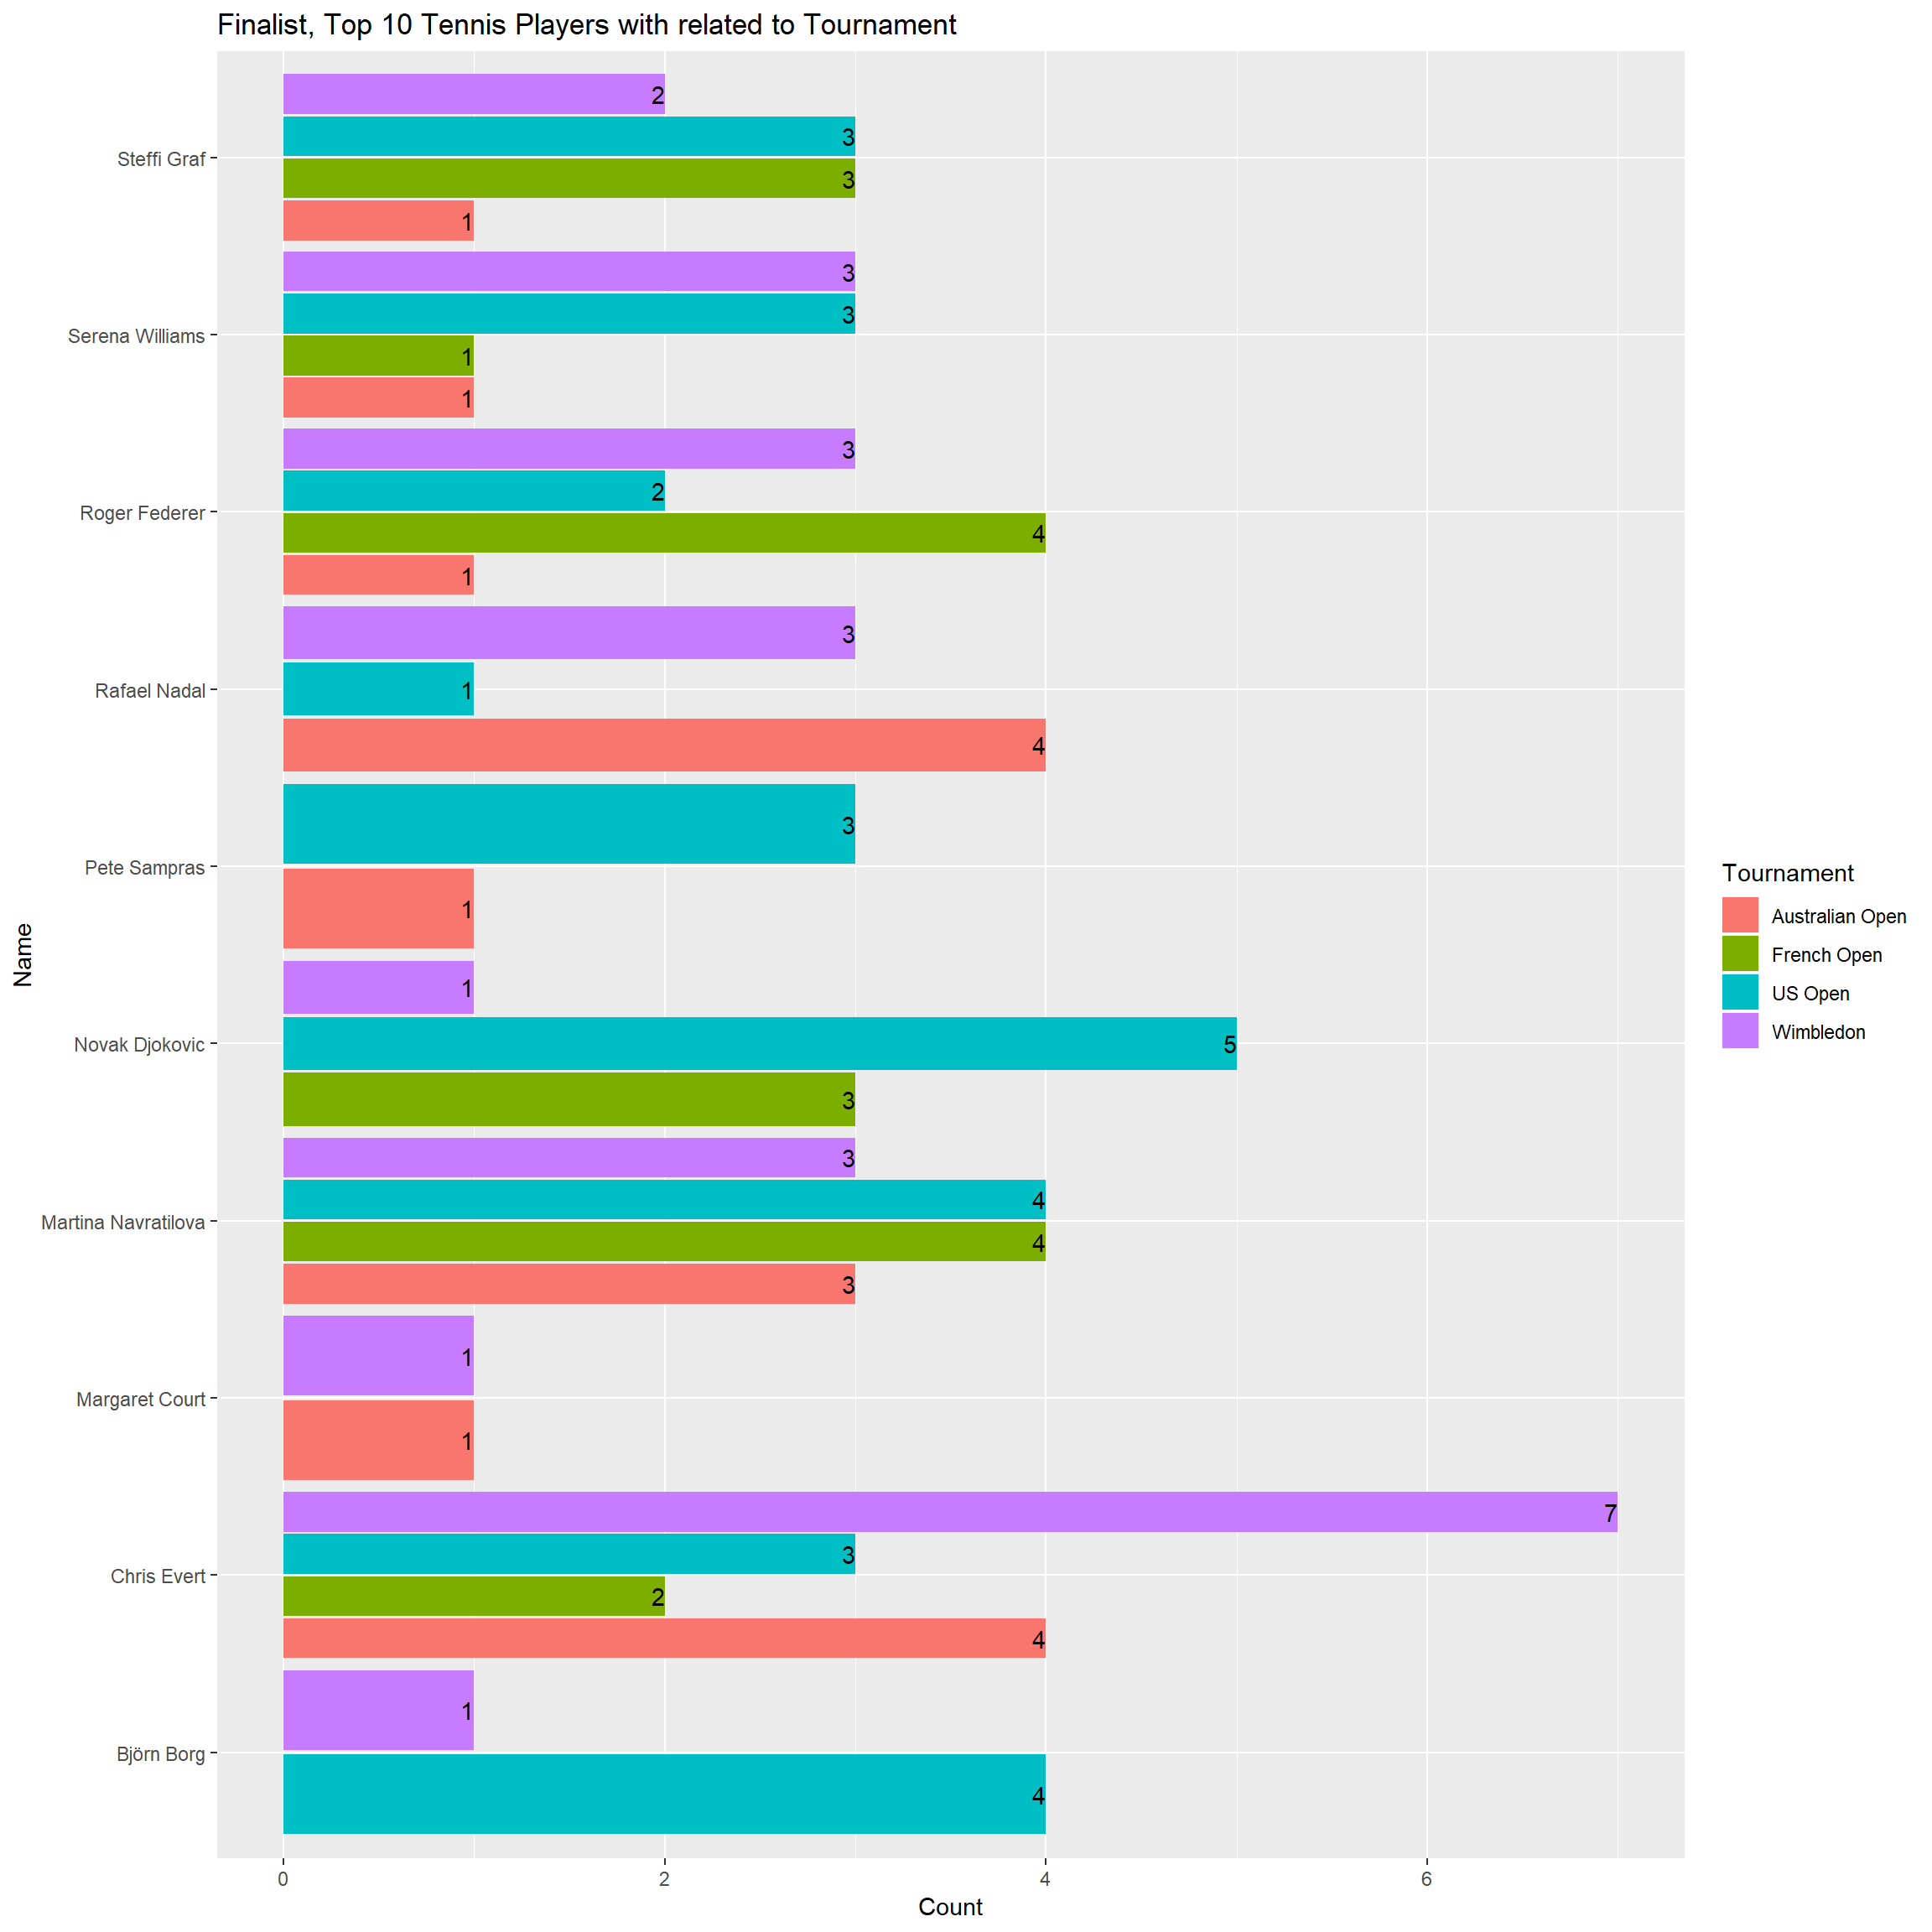
Top 10 Players Semi-Finalist based on Tournament
grand_slam_timeline %>%
      rename(name="player") %>%
      inner_join(top10,"name") %>%
      subset(outcome=="Semi-finalist") %>%
      group_by(name,tournament) %>%
      count() %>%
ggplot(.,aes(x=name,y=n,fill=tournament))+
      geom_col(position =position_dodge(width=0.95))+
      geom_text(aes(label=n),position =position_dodge(width=0.95),hjust=1)+
      coord_flip()+
      labs(fill="Tournament")+
      xlab("Name")+ylab("Count")+
      ggtitle("Semi-Finalist, Top 10 Tennis Players with related to Tournament")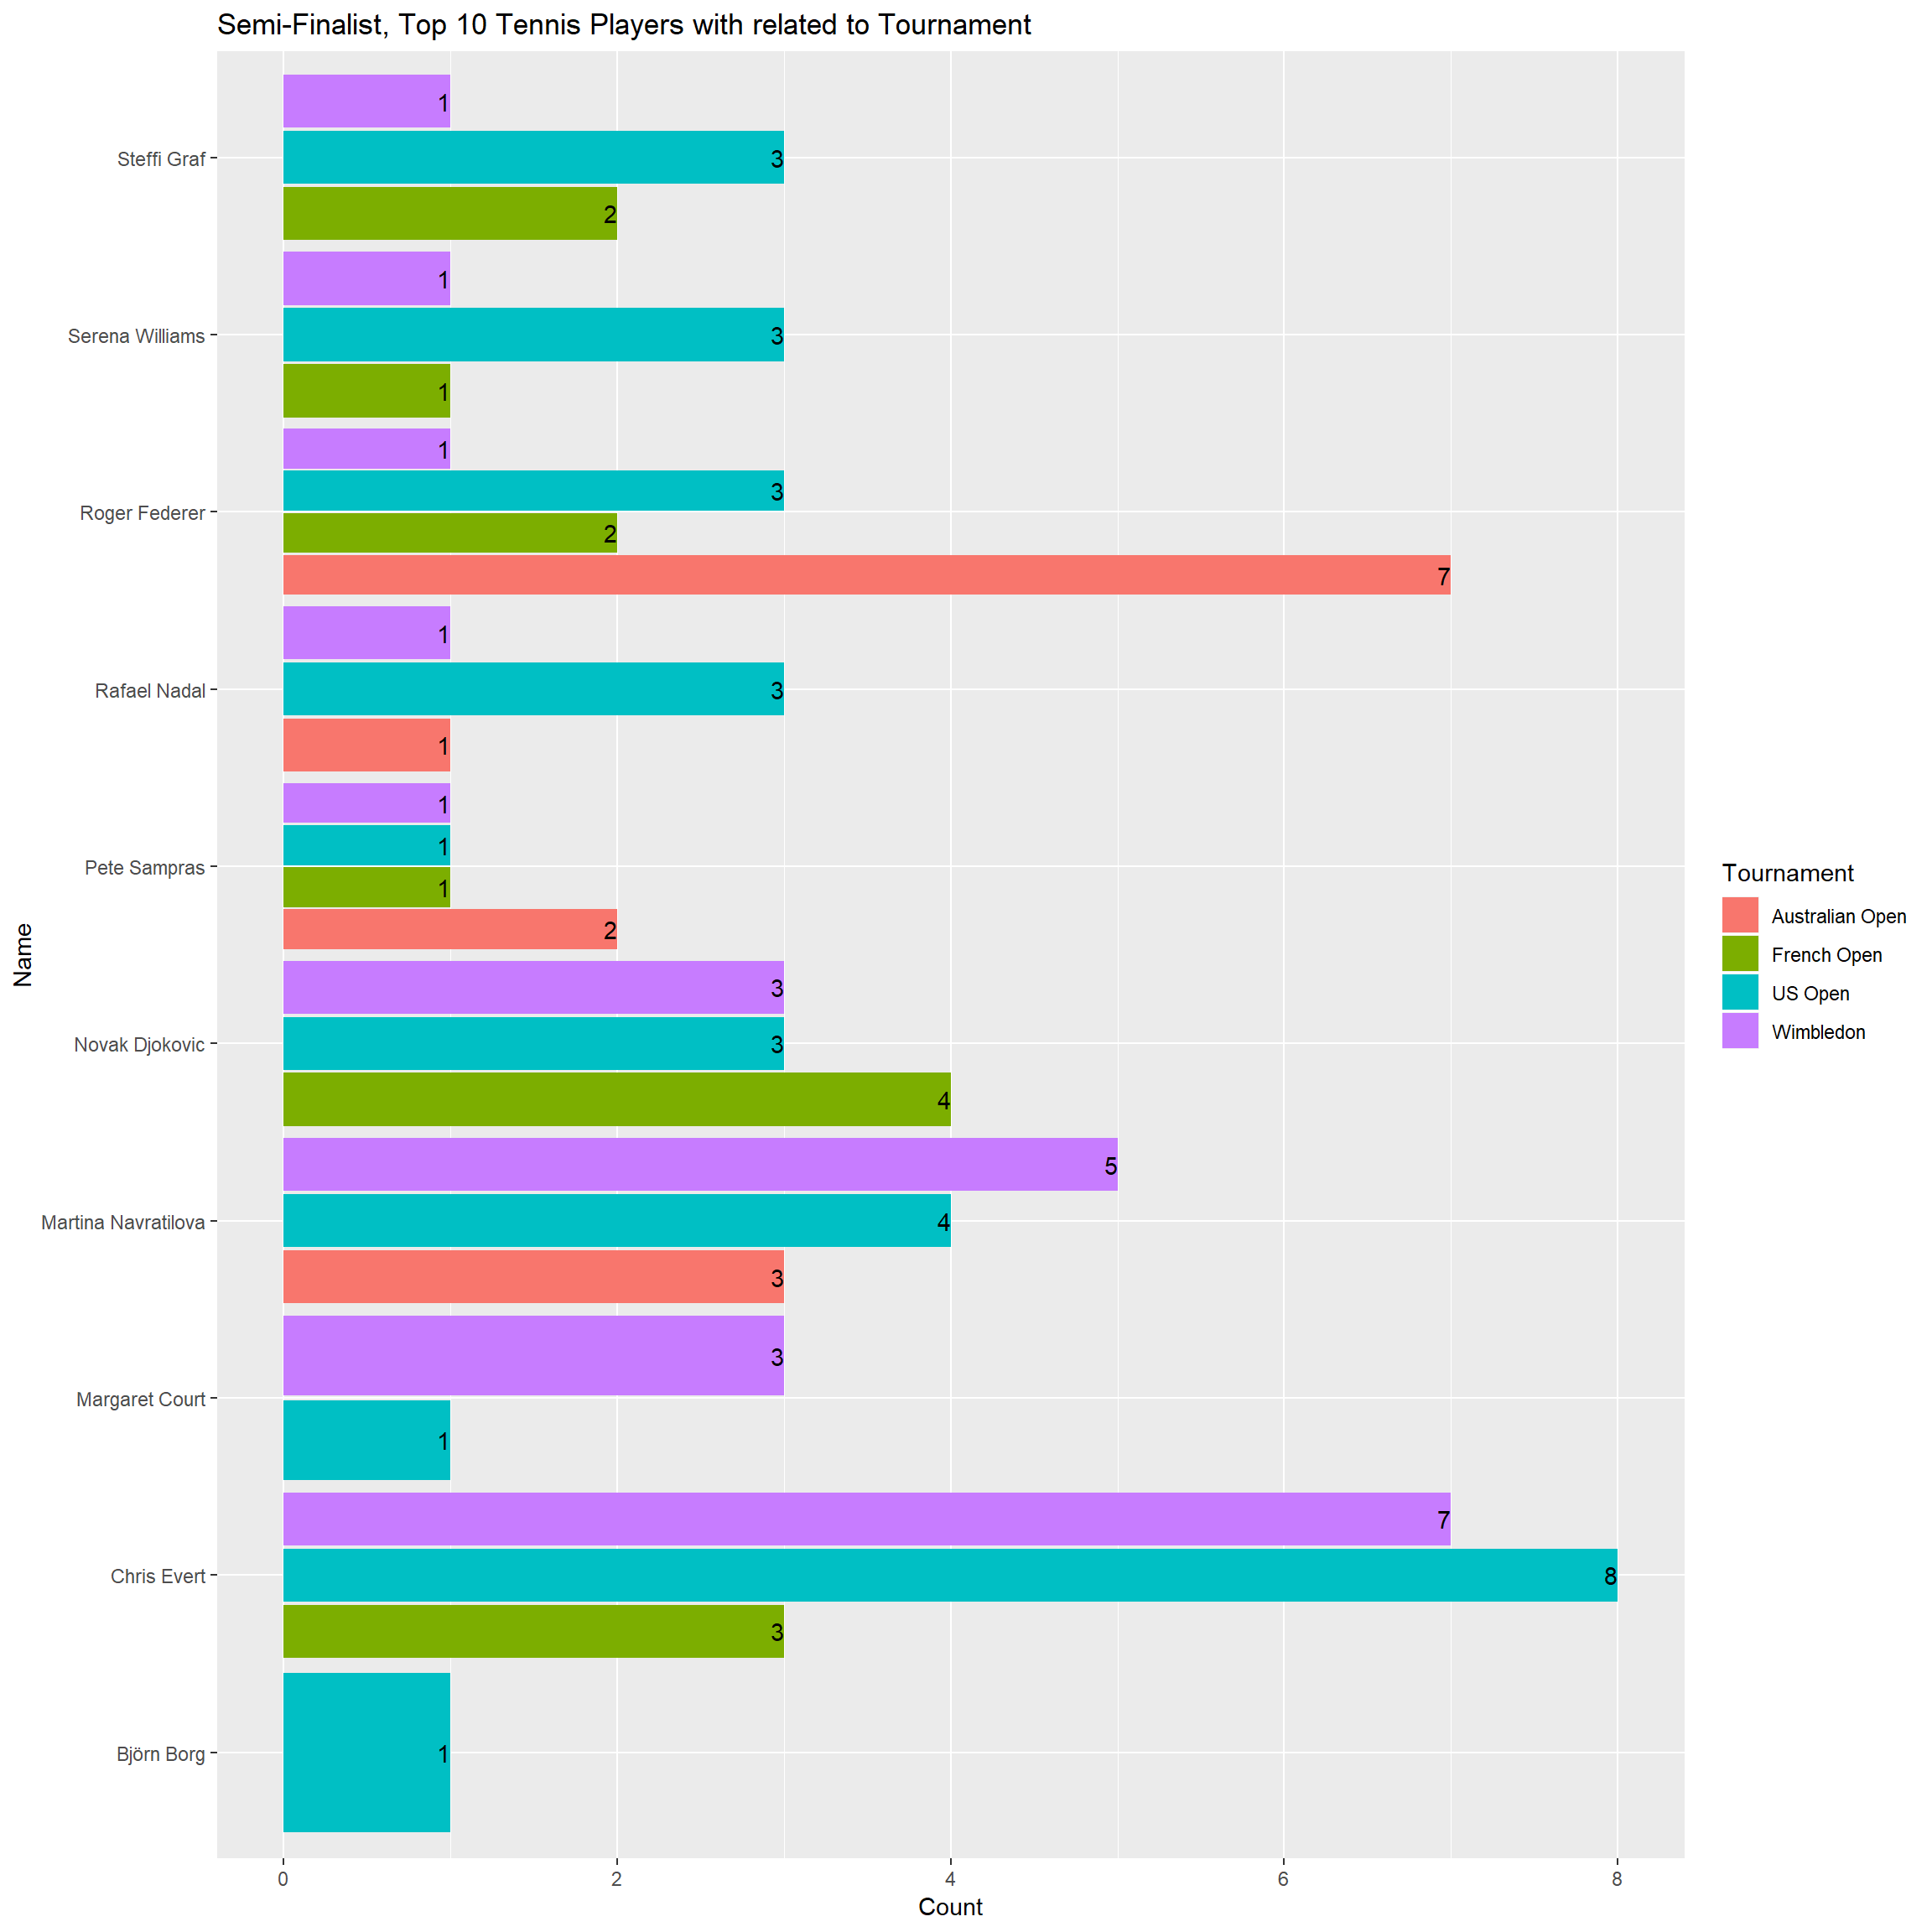
Top 10 Players Retired based on Tournament
grand_slam_timeline %>%
      rename(name="player") %>%
      inner_join(top10,"name") %>%
      subset(outcome=="Retired") %>%
      group_by(name,tournament) %>%
      count() %>%
ggplot(.,aes(x=name,y=n,fill=tournament))+
      geom_col(position =position_dodge(width=0.95))+
      geom_text(aes(label=n),position =position_dodge(width=0.95),hjust=1)+
      coord_flip()+
      labs(fill="Tournament")+
      xlab("Name")+ylab("Count")+
      ggtitle("Retired, Top 10 Tennis Players with related to Tournament")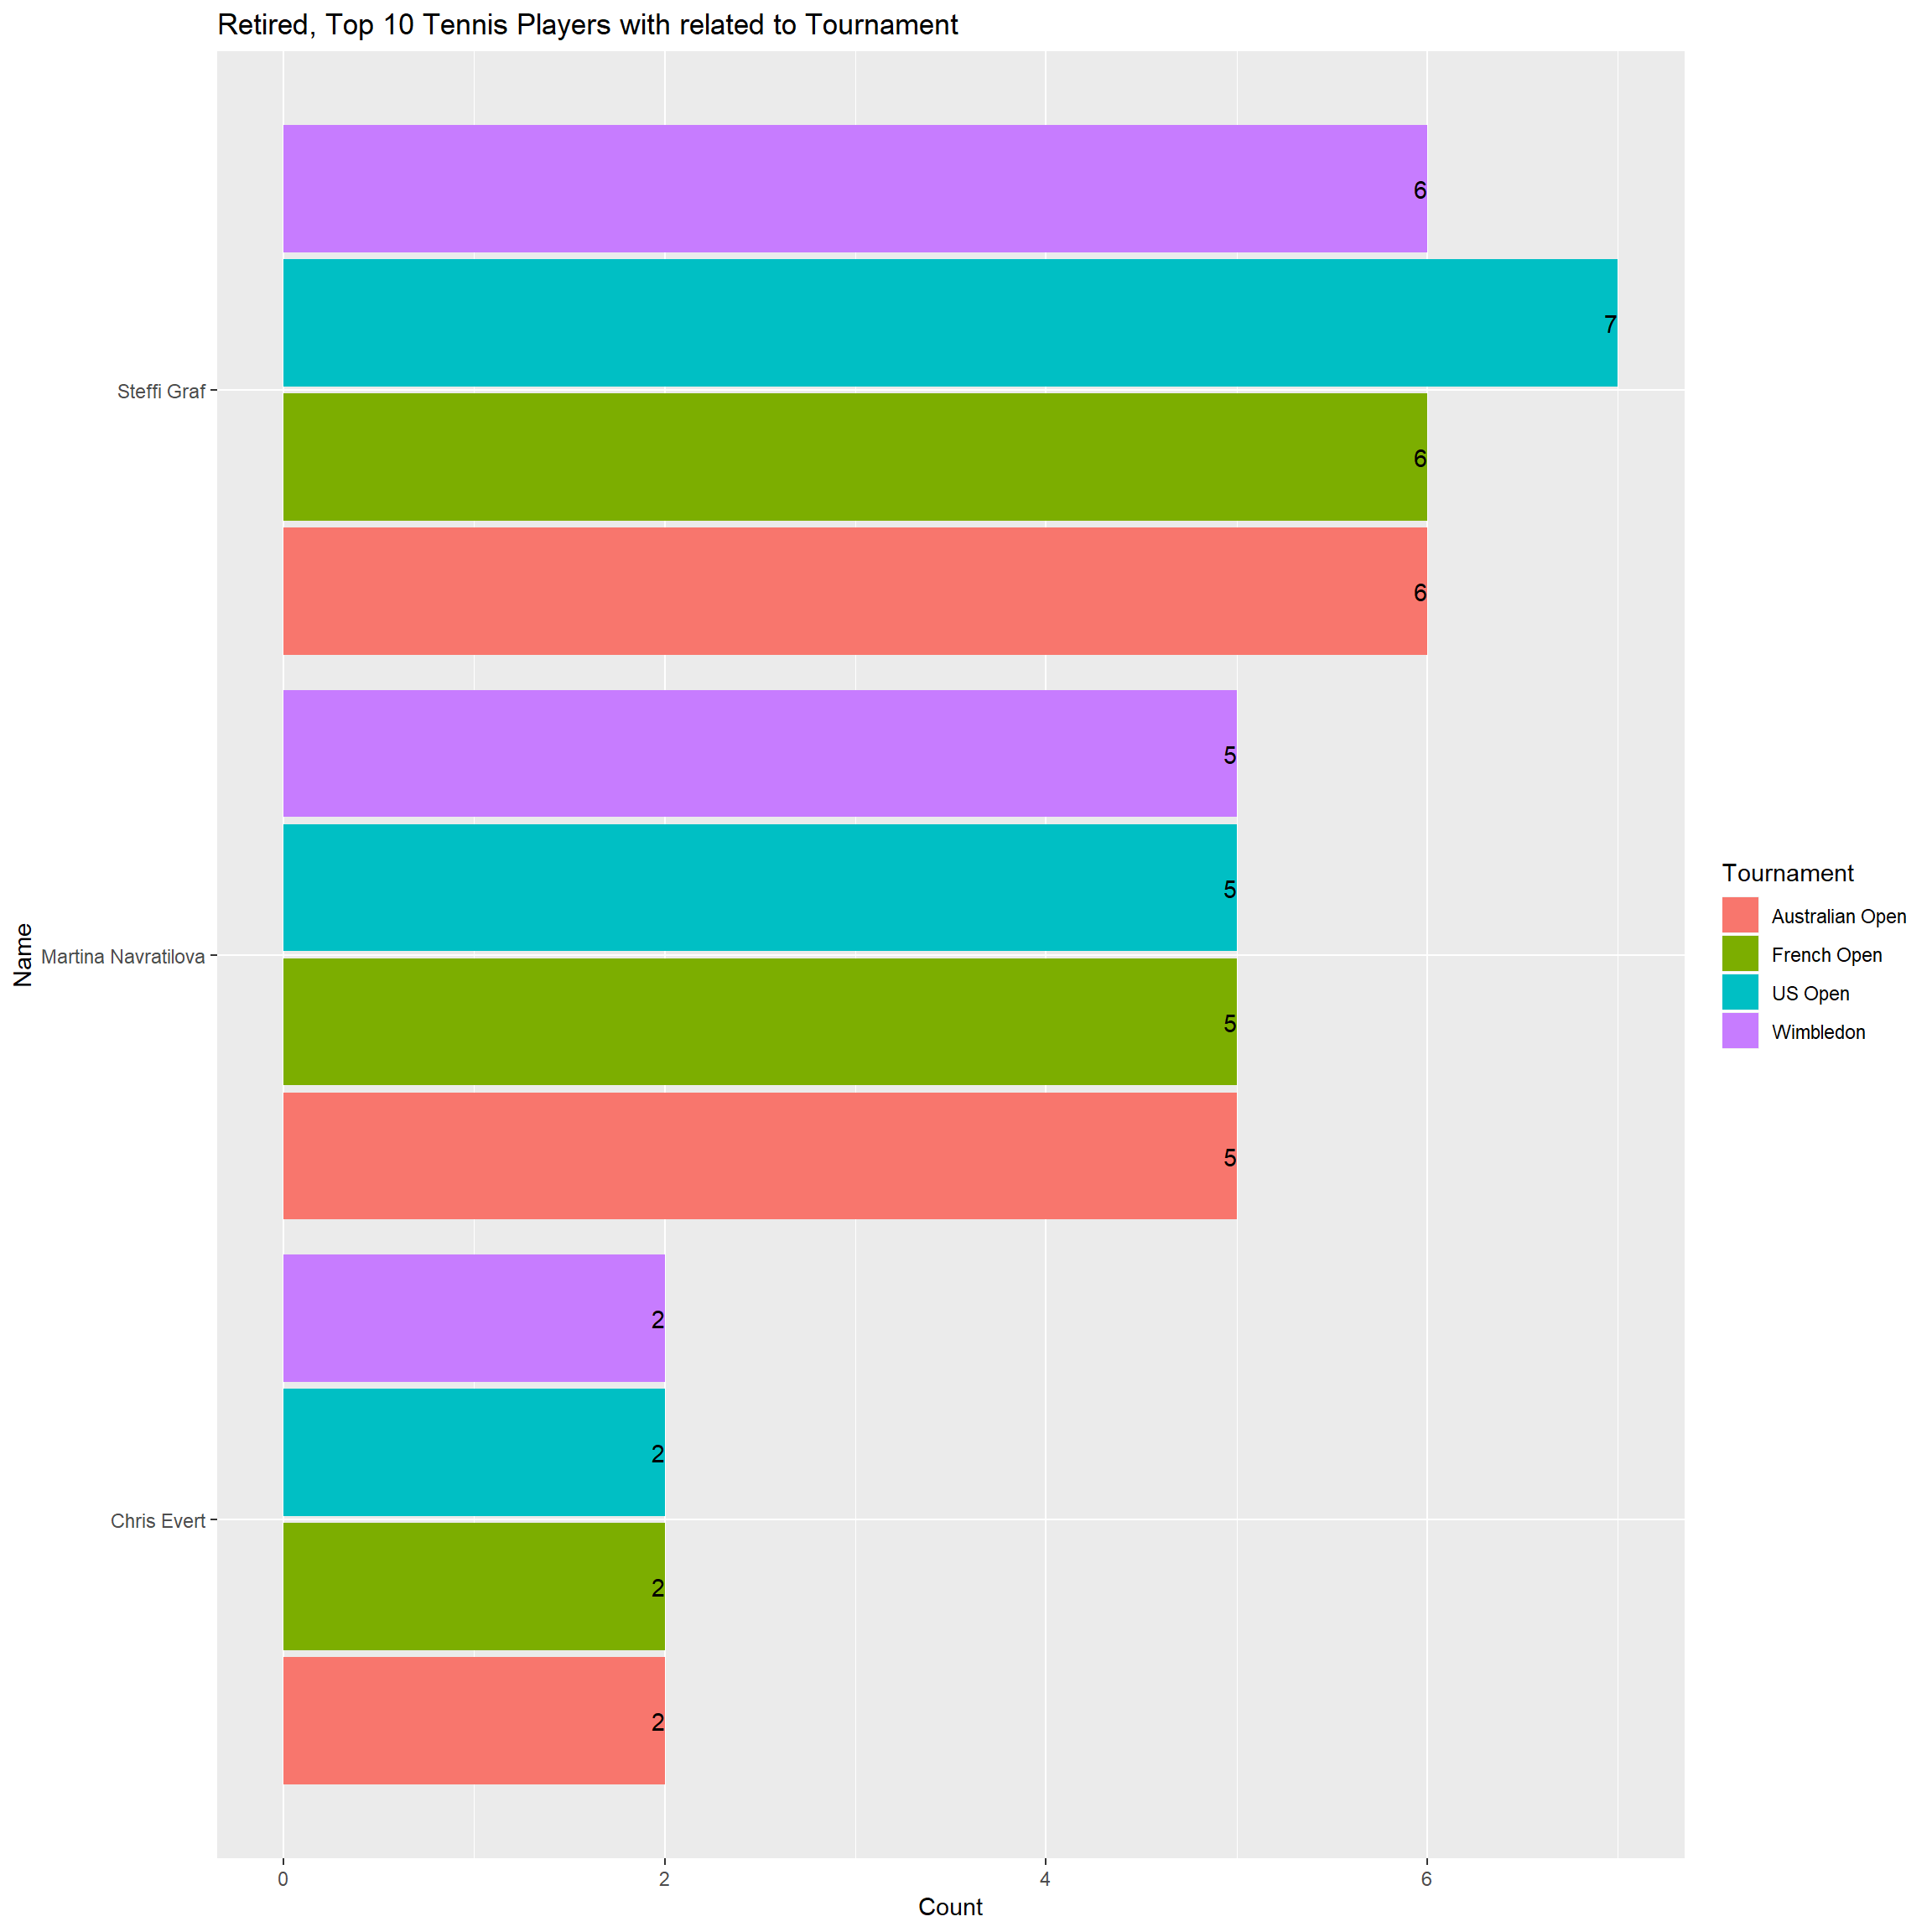
THANK YOU

